Estimated Value: $868,779 - $1,240,000
About This Home
This home is located at 11 Francis Dr, Upton, MA 01568 and is currently estimated at $1,002,945, approximately $338 per square foot. 11 Francis Dr is a home with nearby schools including Nipmuc Regional High School.
Ownership History
We collect this data history from publicly available records. To have your information removed, we recommend requesting removal directly through your county’s website.
Purchase Details
Home Financials for this Owner
Home Financials are based on the most recent Mortgage that was taken out on this home.Home Values in the Area
Average Home Value in this Area
Purchase History
We collect this data history from publicly available records. To have your information removed, we recommend requesting removal directly through your county’s website.
| Date | Buyer | Sale Price | Title Company |
|---|---|---|---|
| $514,155 | -- | ||
| $514,155 | -- |
Mortgage History
We collect this data history from publicly available records. To have your information removed, we recommend requesting removal directly through your county’s website.
| Date | Status | Borrower | Loan Amount |
|---|---|---|---|
| Open | $405,000 | ||
| Closed | $411,000 | ||
| Closed | $411,324 |
Tax History
We collect this data history from publicly available records. To have your information removed, we recommend requesting removal directly through your county’s website.
| Year | Tax Paid | Tax Assessment Tax Assessment Total Assessment is a certain percentage of the fair market value that is determined by local assessors to be the total taxable value of land and additions on the property. | Land | Improvement |
|---|---|---|---|---|
| 2025 | $10,930 | $831,200 | $241,400 | $589,800 |
| 2024 | $10,902 | $796,900 | $234,700 | $562,200 |
| 2023 | $8,081 | $582,600 | $167,600 | $415,000 |
| 2022 | $9,710 | $579,000 | $167,600 | $411,400 |
| 2021 | $9,987 | $601,600 | $204,500 | $397,100 |
| 2020 | $10,361 | $601,700 | $194,500 | $407,200 |
| 2019 | $9,387 | $542,300 | $169,000 | $373,300 |
| 2018 | $9,473 | $549,800 | $175,700 | $374,100 |
| 2017 | $9,485 | $522,300 | $172,300 | $350,000 |
| 2016 | $9,371 | $504,900 | $138,000 | $366,900 |
| 2015 | $8,456 | $498,900 | $138,000 | $360,900 |
| 2014 | $8,217 | $484,800 | $131,100 | $353,700 |
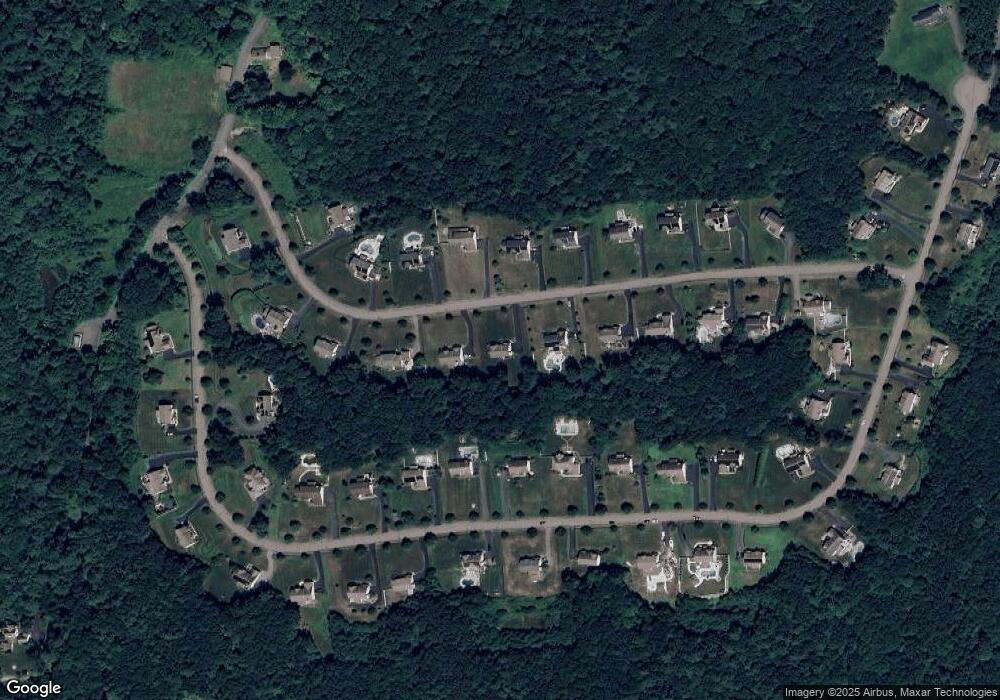
Map
- 11 Howarth Dr
- 35 Howarth Dr
- 5 Boot Shop Rd Unit 5
- 7 Boot Shop Rd Unit 7
- 12 Boot Shop Rd Unit 12
- 21 Boot Shop Rd Unit 21
- 19 Boot Shop Rd Unit 19
- 215 North St
- 201 Spring St
- 186 Spring St
- 42 Stowe Rd
- 51 Lackey St
- 4 Quick Farm Rd
- 27 James Rd Unit 4
- 46 Lackey St
- 48 Lackey St
- 43 Lackey St
- 128 Upton Rd
- 11 Quick Farm Rd
- 110B High St
Ask me questions while you tour the home.