11 Freedom St Chicopee, MA 01013
Willimansett NeighborhoodEstimated Value: $309,313 - $367,000
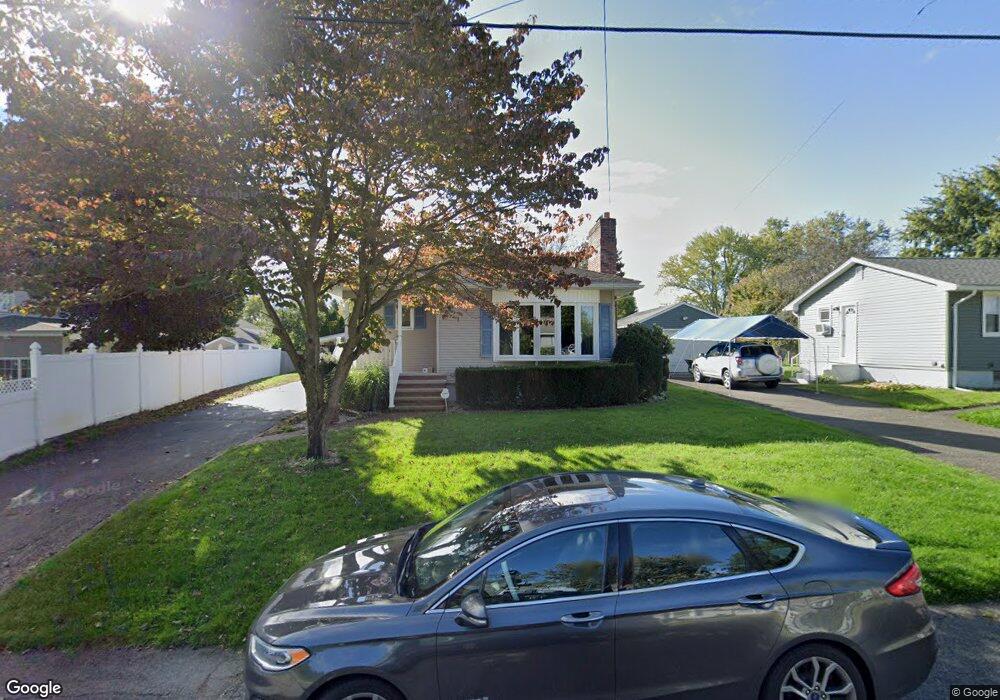
About This Home
This home is located at 11 Freedom St, Chicopee, MA 01013 and is currently estimated at $333,078, approximately $300 per square foot. 11 Freedom St is a home located in Hampden County with nearby schools including Stefanik Elementary School, Bellamy Middle School, and Chicopee High School.
Ownership History
We collect this data history from publicly available records. To have your information removed, we recommend requesting removal directly through your county’s website.
Purchase Details
Home Financials for this Owner
Home Financials are based on the most recent Mortgage that was taken out on this home.Purchase Details
Home Financials for this Owner
Home Financials are based on the most recent Mortgage that was taken out on this home.Home Values in the Area
Average Home Value in this Area
Purchase History
We collect this data history from publicly available records. To have your information removed, we recommend requesting removal directly through your county’s website.
| Date | Buyer | Sale Price | Title Company |
|---|---|---|---|
| $7,000 | -- | ||
| $7,000 | -- | ||
| $157,000 | -- | ||
| $157,000 | -- | ||
| $157,000 | -- | ||
| $157,000 | -- |
Mortgage History
We collect this data history from publicly available records. To have your information removed, we recommend requesting removal directly through your county’s website.
| Date | Status | Borrower | Loan Amount |
|---|---|---|---|
| Open | $162,000 | ||
| Closed | $162,000 | ||
| Previous Owner | $154,574 |
Tax History
We collect this data history from publicly available records. To have your information removed, we recommend requesting removal directly through your county’s website.
| Year | Tax Paid | Tax Assessment Tax Assessment Total Assessment is a certain percentage of the fair market value that is determined by local assessors to be the total taxable value of land and additions on the property. | Land | Improvement |
|---|---|---|---|---|
| 2025 | $4,218 | $278,200 | $89,200 | $189,000 |
| 2024 | $4,006 | $271,400 | $87,400 | $184,000 |
| 2023 | $3,821 | $252,200 | $79,500 | $172,700 |
| 2022 | $3,695 | $217,500 | $69,200 | $148,300 |
| 2021 | $3,540 | $201,000 | $62,900 | $138,100 |
| 2020 | $3,375 | $193,300 | $62,900 | $130,400 |
| 2019 | $2,965 | $165,100 | $62,900 | $102,200 |
| 2018 | $2,900 | $158,400 | $59,900 | $98,500 |
| 2017 | $2,766 | $159,800 | $59,800 | $100,000 |
| 2016 | $2,499 | $147,800 | $59,800 | $88,000 |
| 2015 | $2,661 | $151,700 | $59,800 | $91,900 |
| 2014 | $1,330 | $151,700 | $59,800 | $91,900 |
Map
- 86 Beaumont Ave
- 77 Granville Ave
- 44 Wilson Ave
- 5 Kurtz St
- 445 Oldfield Rd
- 63 Stedman St
- 83 Mckinstry Ave
- 90 Mckinstry Ave Unit 117
- 90 Mckinstry Ave Unit 106
- 73 Gardner Rd
- 12 Daniel Dr
- 84 Wanda St
- 55 Empire St Unit 11
- 94 Cora Ave
- 71 Worthington St
- 24 Daley St
- 35 Lower Grape St
- 80 Brush Hill Ave Unit 65
- 80 Brush Hill Ave Unit 40
- 2 Oscar St
Ask me questions while you tour the home.