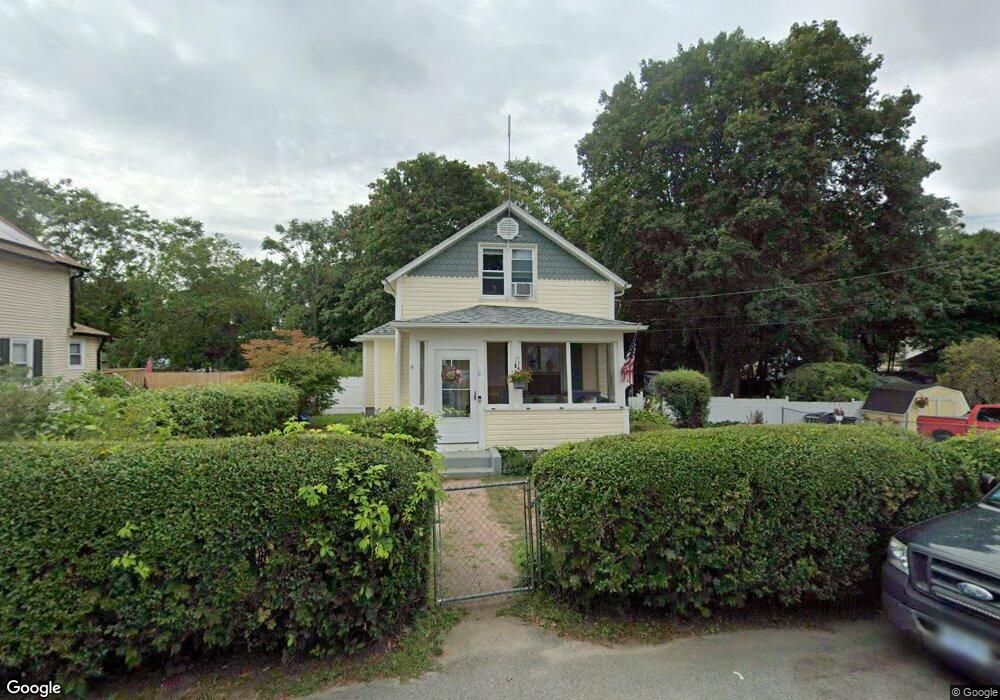
11 Greene St Coventry, RI 02816
Estimated Value: $345,861 - $402,000
About This Home
This home is located at 11 Greene St, Coventry, RI 02816 and is currently estimated at $370,965, approximately $347 per square foot. 11 Greene St is a home located in Kent County with nearby schools including Alan Shawn Feinstein Ms Of Cov, Coventry High School, and Father John V. Doyle School.
Ownership History
We collect this data history from publicly available records. To have your information removed, we recommend requesting removal directly through your county’s website.
Purchase Details
Purchase History
We collect this data history from publicly available records. To have your information removed, we recommend requesting removal directly through your county’s website.
| Date | Buyer | Sale Price | Title Company |
|---|---|---|---|
| $99,000 | -- |
Mortgage History
We collect this data history from publicly available records. To have your information removed, we recommend requesting removal directly through your county’s website.
| Date | Status | Borrower | Loan Amount |
|---|---|---|---|
| Open | $192,800 | ||
| Closed | $202,000 | ||
| Closed | $173,875 | ||
| Closed | $15,000 |
Tax History
We collect this data history from publicly available records. To have your information removed, we recommend requesting removal directly through your county’s website.
| Year | Tax Paid | Tax Assessment Tax Assessment Total Assessment is a certain percentage of the fair market value that is determined by local assessors to be the total taxable value of land and additions on the property. | Land | Improvement |
|---|---|---|---|---|
| 2025 | $4,302 | $267,400 | $109,200 | $158,200 |
| 2024 | $4,236 | $267,400 | $109,200 | $158,200 |
| 2023 | $4,099 | $267,400 | $109,200 | $158,200 |
| 2022 | $3,710 | $189,600 | $105,000 | $84,600 |
| 2021 | $3,678 | $189,600 | $105,000 | $84,600 |
| 2020 | $4,217 | $189,600 | $105,000 | $84,600 |
| 2019 | $3,705 | $166,600 | $88,100 | $78,500 |
| 2018 | $3,600 | $166,600 | $88,100 | $78,500 |
| 2017 | $3,495 | $166,600 | $88,100 | $78,500 |
| 2016 | $3,376 | $157,700 | $75,100 | $82,600 |
| 2015 | $3,285 | $157,700 | $75,100 | $82,600 |
| 2014 | $3,216 | $157,700 | $75,100 | $82,600 |
| 2013 | $3,224 | $172,800 | $88,800 | $84,000 |
Map
- 6 Pilgrim Ave
- 32 Pilgrim Ave
- 57 Laurel Ave
- 505 Washington St
- 513 Washington St
- 12 Hazard St
- 29 Anthony St
- 31 Anthony St Unit 33
- 3 Albro Ln
- 432 Fairview Ave
- 75 Knotty Oak Rd
- 15 Hope Ct
- 376 Fairview Ave
- 29 E Shore Dr
- 21 Darton St
- 333 Tiogue Ave
- 325 Washington St Unit 1
- 9 Regent St Unit 11
- 18 West St
- 37 Aldrich St
Ask me questions while you tour the home.