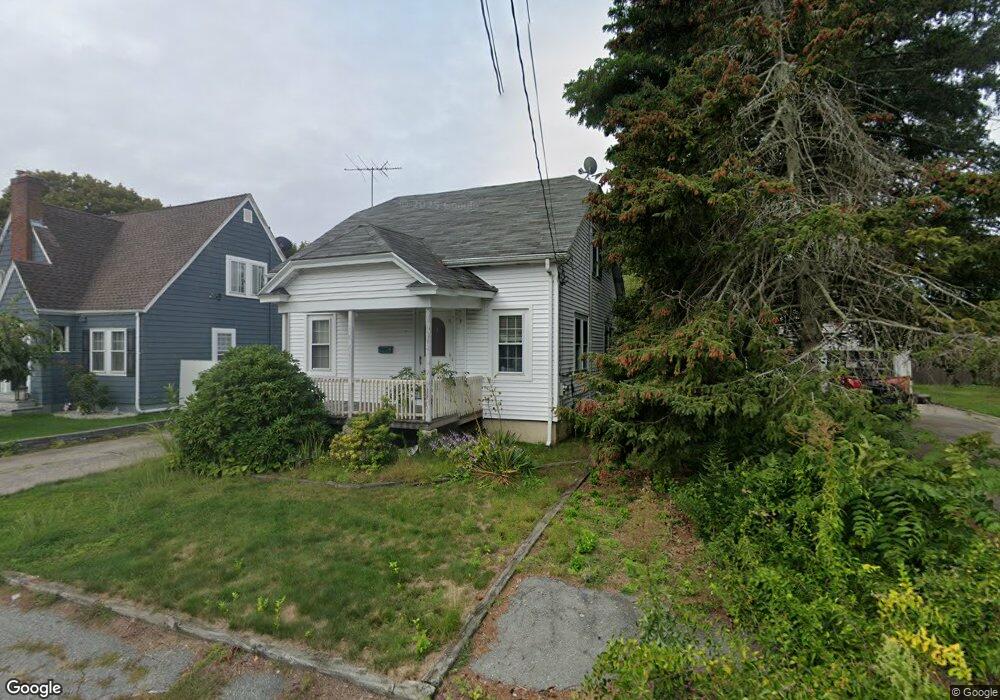
11 Hade Ct Warwick, RI 02889
Hoxie NeighborhoodEstimated Value: $381,000 - $398,000
About This Home
This home is located at 11 Hade Ct, Warwick, RI 02889 and is currently estimated at $391,065, approximately $264 per square foot. 11 Hade Ct is a home located in Kent County with nearby schools including Saint Kevin School, St. Peter School, and Bishop Hendricken High School.
Ownership History
We collect this data history from publicly available records. To have your information removed, we recommend requesting removal directly through your county’s website.
Purchase Details
Purchase Details
Home Values in the Area
Average Home Value in this Area
Purchase History
We collect this data history from publicly available records. To have your information removed, we recommend requesting removal directly through your county’s website.
| Date | Buyer | Sale Price | Title Company |
|---|---|---|---|
| $206,000 | -- | ||
| $95,000 | -- |
Mortgage History
We collect this data history from publicly available records. To have your information removed, we recommend requesting removal directly through your county’s website.
| Date | Status | Borrower | Loan Amount |
|---|---|---|---|
| Previous Owner | $112,200 | ||
| Previous Owner | $103,000 | ||
| Previous Owner | $20,000 | ||
| Previous Owner | $10,000 |
Tax History
We collect this data history from publicly available records. To have your information removed, we recommend requesting removal directly through your county’s website.
| Year | Tax Paid | Tax Assessment Tax Assessment Total Assessment is a certain percentage of the fair market value that is determined by local assessors to be the total taxable value of land and additions on the property. | Land | Improvement |
|---|---|---|---|---|
| 2025 | $4,040 | $318,100 | $102,600 | $215,500 |
| 2024 | $3,740 | $258,500 | $84,800 | $173,700 |
| 2023 | $3,668 | $258,500 | $84,800 | $173,700 |
| 2022 | $3,557 | $189,900 | $57,800 | $132,100 |
| 2021 | $3,557 | $189,900 | $57,800 | $132,100 |
| 2020 | $3,557 | $189,900 | $57,800 | $132,100 |
| 2019 | $3,557 | $189,900 | $57,800 | $132,100 |
| 2018 | $2,875 | $138,200 | $51,700 | $86,500 |
| 2017 | $2,797 | $138,200 | $51,700 | $86,500 |
| 2016 | $2,797 | $138,200 | $51,700 | $86,500 |
| 2015 | $2,739 | $132,000 | $53,200 | $78,800 |
| 2014 | $2,648 | $132,000 | $53,200 | $78,800 |
| 2013 | $2,612 | $132,000 | $53,200 | $78,800 |
Map
- 95 Harmony Ct
- 26 Crandall Ct
- 30 Recess Ln
- 5 Recess Ln
- 24 Magnolia St
- 72 W Shore Rd Unit 202
- 417 Squantum Dr
- 400 Lake Shore Dr
- 59 Wells Ave
- 161 W Shore Rd Unit C5
- 3 Glendale Ave
- 76 Brewster Dr
- 50 Brewster Dr
- 432 Lake Shore Dr
- 21 Falcon Ave
- 90 Frontier Rd
- 157 Betsey Williams Dr
- 301 W Shore Rd Unit 19
- 121 Fern St
- 128 Fern St
Ask me questions while you tour the home.