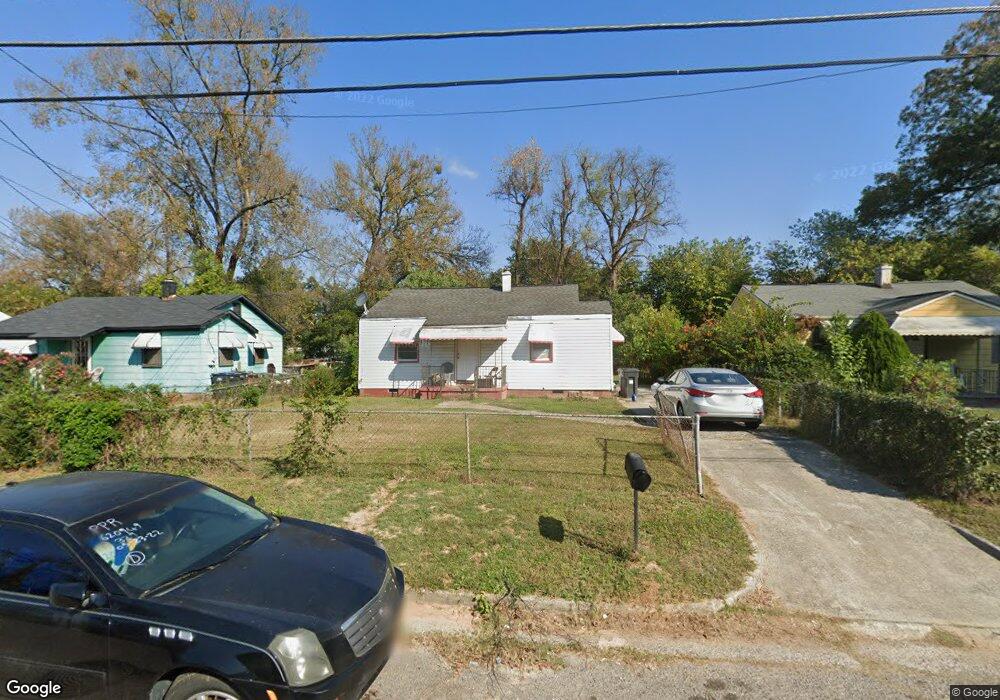
11 Hale St Augusta, GA 30901
Olde Town-Pinched Gut NeighborhoodEstimated Value: $40,000 - $86,000
2
Beds
1
Bath
794
Sq Ft
$91/Sq Ft
Est. Value
About This Home
This home is located at 11 Hale St, Augusta, GA 30901 and is currently estimated at $71,859, approximately $90 per square foot. 11 Hale St is a home located in Richmond County with nearby schools including W.S. Hornsby School, W.S. Hornsby Elementary School, and Johnson Magnet.
Ownership History
Date
Name
Owned For
Owner Type
Purchase Details
Closed on
Sep 29, 2023
Sold by
Brown Betty M
Bought by
Mitchell Taura and Mitchell Taura L
Current Estimated Value
Purchase Details
Closed on
May 21, 2020
Sold by
Jefferson Twila
Bought by
Mitchell Taura
Purchase Details
Closed on
Apr 23, 1997
Sold by
Brown Henry L
Bought by
Brown Betty M
Purchase Details
Closed on
Mar 3, 1997
Sold by
Brown Henry L
Bought by
Brown Betty M
Purchase Details
Closed on
Aug 1, 1976
Create a Home Valuation Report for This Property
The Home Valuation Report is an in-depth analysis detailing your home's value as well as a comparison with similar homes in the area
Home Values in the Area
Average Home Value in this Area
Purchase History
We collect this data history from publicly available records. To have your information removed, we recommend requesting removal directly through your county’s website.
| Date | Buyer | Sale Price | Title Company |
|---|---|---|---|
| Mitchell Taura | $7,000 | -- | |
| Mitchell Taura | -- | -- | |
| Brown Betty M | -- | -- | |
| Brown Henry Lee | -- | -- | |
| Washington Antoinette Y | -- | -- | |
| Brown Betty M | -- | -- | |
| Brown Henry Lee | $20,000 | -- | |
| Washington Antoinet | -- | -- | |
| -- | $12,000 | -- |
Source: Public Records
Tax History
| Year | Tax Paid | Tax Assessment Tax Assessment Total Assessment is a certain percentage of the fair market value that is determined by local assessors to be the total taxable value of land and additions on the property. | Land | Improvement |
|---|---|---|---|---|
| 2025 | $1,113 | $25,180 | $1,600 | $23,580 |
| 2024 | $1,113 | $20,236 | $1,600 | $18,636 |
| 2023 | $904 | $22,668 | $1,600 | $21,068 |
| 2022 | $726 | $13,601 | $1,600 | $12,001 |
| 2021 | $901 | $12,616 | $1,600 | $11,016 |
| 2020 | $968 | $12,616 | $1,600 | $11,016 |
| 2019 | $918 | $10,355 | $1,600 | $8,755 |
| 2018 | $680 | $10,355 | $1,600 | $8,755 |
| 2017 | $678 | $10,355 | $1,600 | $8,755 |
| 2016 | $817 | $10,355 | $1,600 | $8,755 |
| 2015 | $681 | $10,355 | $1,600 | $8,755 |
| 2014 | $682 | $10,355 | $1,600 | $8,755 |
Source: Public Records
Map
Nearby Homes
Your Personal Tour Guide
Ask me questions while you tour the home.