
Seller's Agent in 2025
Vilma Michienzi
RE/MAX
(508) 404-8007
28 in this area
86 Total Sales
Estimated Value: $847,000 - $899,887
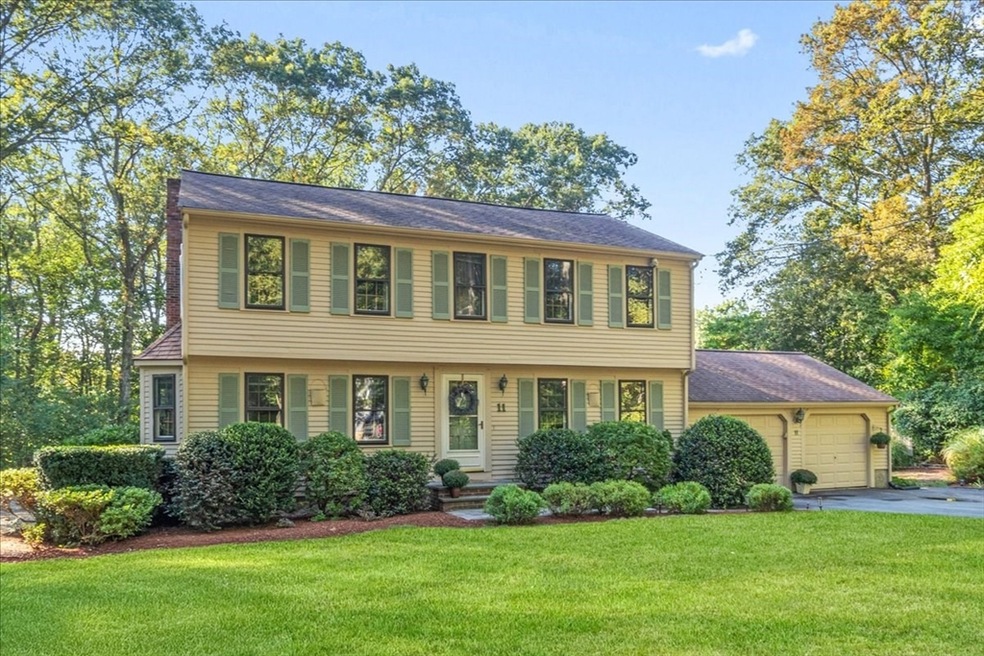
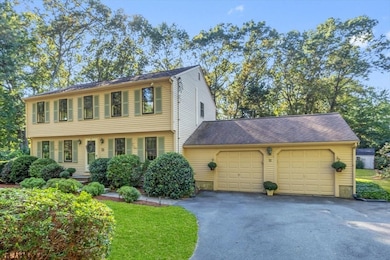
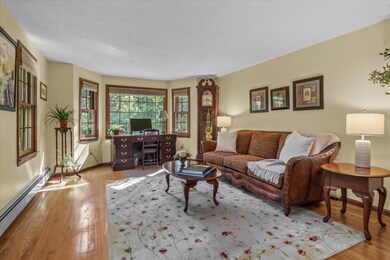
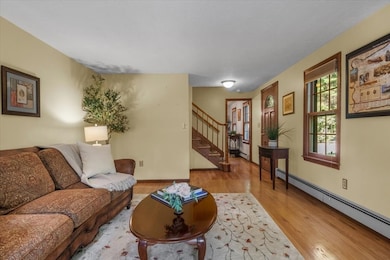
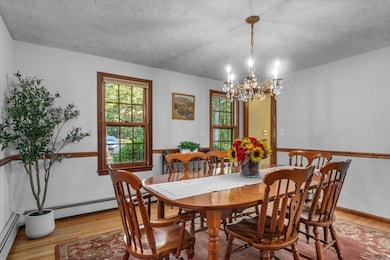
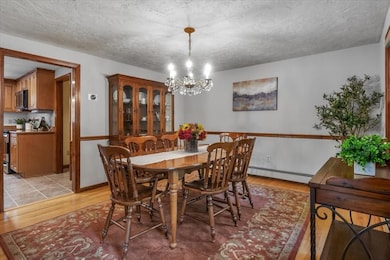
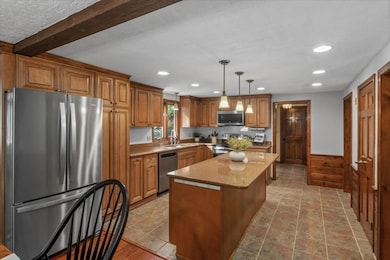
Nestled at the end of a cul-de-sac on a generous one-acre lot, this spacious 4-bedroom, 2.5-bath Colonial offers the perfect blend of comfort and functionality. The expanded kitchen boasts warm maple cabinetry, a large center island, and flows seamlessly into a sun-drenched family room filled with windows—ideal for everyday living and entertaining. A formal living room and dining room provide additional space for gatherings and special occasions. Upstairs, you’ll find four generously sized bedrooms with gleaming hardwood floors, including a serene primary suite with a private en suite bath. The large main bath completes the second level.The finished basement adds flexible bonus space—perfect for a home office, gym, or playroom. Outside, enjoy the spacious backyard with endless possibilities for outdoor enjoyment. Don’t miss this opportunity to settle into a prime North Walpole location just in time for the holidays!
Last Buyer's Agent
Non Member
Non Member Office
We collect this data history from publicly available records. To have your information removed, we recommend requesting removal directly through your county’s website.
| Date | Buyer | Sale Price | Title Company |
|---|---|---|---|
| Michienzi Amanda | $860,000 | -- | |
| 11 Hickory Lane Rt | -- | -- |
We collect this data history from publicly available records. To have your information removed, we recommend requesting removal directly through your county’s website.
| Date | Status | Borrower | Loan Amount |
|---|---|---|---|
| Open | Michienzi Amanda | $731,000 |
| Date | Event | Price | List to Sale | Price per Sq Ft |
|---|---|---|---|---|
| 10/31/2025 10/31/25 | Sold | $860,000 | +1.2% | $332 / Sq Ft |
| 09/23/2025 09/23/25 | Pending | -- | -- | -- |
| 09/17/2025 09/17/25 | For Sale | $849,900 | -- | $328 / Sq Ft |
| Year | Tax Paid | Tax Assessment Tax Assessment Total Assessment is a certain percentage of the fair market value that is determined by local assessors to be the total taxable value of land and additions on the property. | Land | Improvement |
|---|---|---|---|---|
| 2025 | $10,583 | $824,900 | $412,000 | $412,900 |
| 2024 | $10,272 | $777,000 | $396,400 | $380,600 |
| 2023 | $9,798 | $705,400 | $344,500 | $360,900 |
| 2022 | $9,698 | $670,700 | $319,100 | $351,600 |
| 2021 | $9,512 | $641,000 | $301,300 | $339,700 |
| 2020 | $9,259 | $617,700 | $284,000 | $333,700 |
| 2019 | $8,929 | $591,300 | $273,200 | $318,100 |
| 2018 | $8,591 | $562,600 | $263,000 | $299,600 |
| 2017 | $8,350 | $544,700 | $252,700 | $292,000 |
| 2016 | $8,138 | $523,000 | $245,200 | $277,800 |
| 2015 | $8,476 | $539,900 | $269,700 | $270,200 |
| 2014 | $8,266 | $524,500 | $269,700 | $254,800 |
Seller's Agent in 2025
Vilma Michienzi
RE/MAX
(508) 404-8007
28 in this area
86 Total Sales
N
Buyer's Agent in 2025
Non Member
Non Member Office
Source: MLS Property Information Network (MLS PIN)
MLS Number: 73431984
APN: WALP-000011-000201
Disclaimer: Certain information contained herein is derived from information provided by parties other than Homes.com. All information provided is deemed reliable, but is not guaranteed to be accurate and should be independently verified.
![]() The property listing data and information, or the Images, set forth herein were provided to MLS Property Information Network, Inc. from third party sources, including sellers, lessors and public records, and were compiled by MLS Property Information Network, Inc. The property listing data and information, and the Images, are for the personal, non-commercial use of consumers having a good faith interest in purchasing or leasing listed properties of the type displayed to them and may not be used for any purpose other than to identify prospective properties which such consumers may have a good faith interest in purchasing or leasing. MLS Property Information Network, Inc. and its subscribers disclaim any and all representations and warranties as to the accuracy of the property listing data and information, or as to the accuracy of any of the Images, set forth herein.
The property listing data and information, or the Images, set forth herein were provided to MLS Property Information Network, Inc. from third party sources, including sellers, lessors and public records, and were compiled by MLS Property Information Network, Inc. The property listing data and information, and the Images, are for the personal, non-commercial use of consumers having a good faith interest in purchasing or leasing listed properties of the type displayed to them and may not be used for any purpose other than to identify prospective properties which such consumers may have a good faith interest in purchasing or leasing. MLS Property Information Network, Inc. and its subscribers disclaim any and all representations and warranties as to the accuracy of the property listing data and information, or as to the accuracy of any of the Images, set forth herein.
Ask me questions while you tour the home.