
11 High Ct Poughkeepsie, NY 12603
Estimated payment $3,381/month
Highlights
- Above Ground Pool
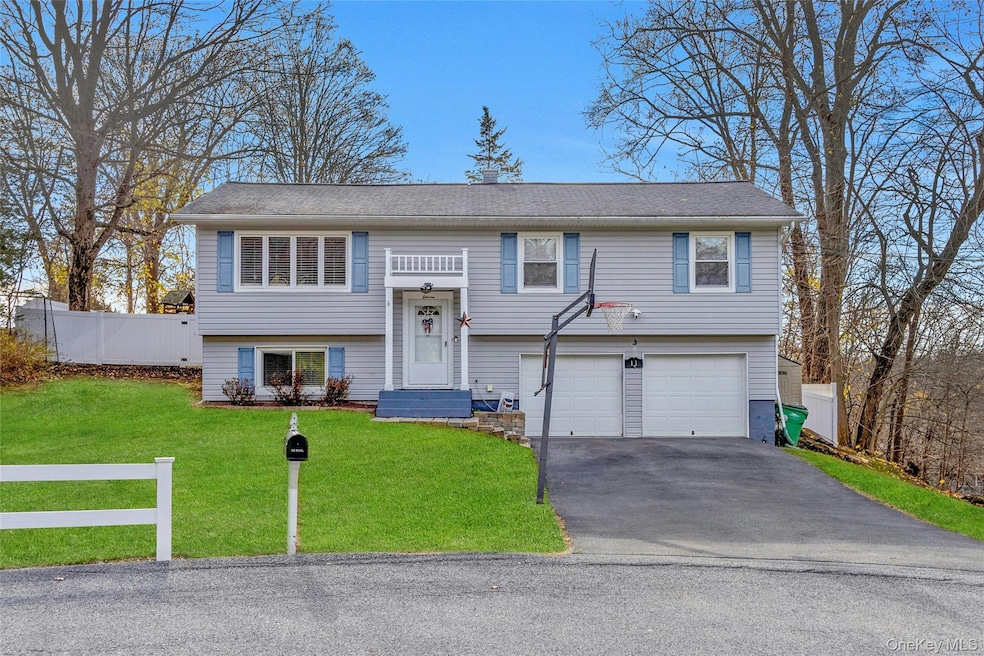
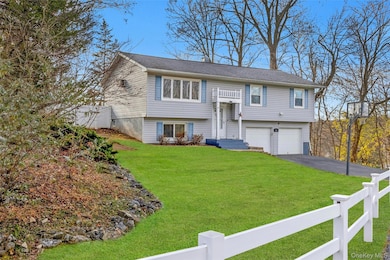
- Raised Ranch Architecture
- Main Floor Bedroom
- Open Floorplan
- Wood Flooring
- Formal Dining Room
About This Home
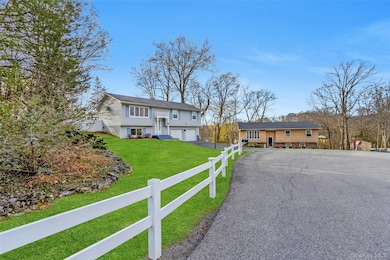
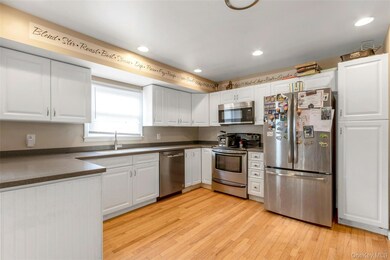
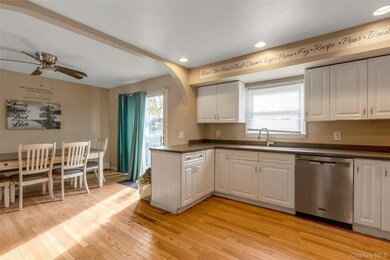
Just Listed – Sutton Park! Beautifully maintained 4-bedroom, multi-bath home, perfectly positioned at the summit of a quiet cul-de-sac in one of the area’s most desirable neighborhoods. Bright and modern kitchen featuring light cabinetry, stainless steel appliances, and hardwood floors. An elegant arched opening leads to the formal dining room, complete with sliders to an expansive, full-length deck, ideal for grilling, and outdoor living. The spacious living room is filled with natural light with wall of four casement picture windows. The primary bedroom offers a peaceful retreat with its own sliders to the deck—perfect for enjoying morning coffee with tranquil views. The lower level adds great flexibility with an additional bedroom and den, plus a convenient laundry/powder room combination. Additional highlights include modern vinyl windows, vinyl siding, and a large 24' x 24' two-car garage with abundant storage. Step outside to a fully fenced yard overlooking a serene setting with an above-ground pool and plenty of open space for playsets, Great for gardening, or recreation and pets. Cul-de-sac location. Municipal Water and Sewer. Prime Location & Lifestyle Amenities: Only 9 miles to Metro-North Railroad for an easy NYC commute. Great dining options nearby, including Mill House Brewing Company. In the Great Hudson Valley - Minutes to the Walkway Over the Hudson, featuring July 4th fireworks. Local wineries to explore: Benmarl, Milea, and Millbrook. Coveted Wappinger Schools. Elementary includes: K-2 Vassar Rd. Elementary and 3rd - 6th Kinry Road Elementary. GOLFING: Enjoy golf at Vassar and McCann Memorial golf courses. Convenient travel options: 7 miles to Hudson Regional Airport, 23 miles to Stewart International Airport. Nearby historic sites, including the Vassar College and Marist University campus. Nearby Renowned Culinary Institute of America. This home blends comfort, convenience, and a true Hudson Valley lifestyle. Don’t miss the opportunity to make it yours! Sought-after school zone - Roy C Ketcham High School
Listing Agent
Howard Hanna Rand Realty Brokerage Phone: 845-358-7310 License #30MO0838279 Listed on: 11/23/2025

Home Details
Home Type
- Single Family
Est. Annual Taxes
- $9,880
Year Built
- Built in 1974
Lot Details
- 15,682 Sq Ft Lot
- Cul-De-Sac
- Vinyl Fence
- Level Lot
Parking
- 2 Car Garage
- Driveway
Home Design
- Raised Ranch Architecture
- Bi-Level Home
- Vinyl Siding
Interior Spaces
- 1,696 Sq Ft Home
- Open Floorplan
- Casement Windows
- Formal Dining Room
- Property Views
Kitchen
- Gas Range
- Microwave
- Dishwasher
Flooring
- Wood
- Carpet
Bedrooms and Bathrooms
- 4 Bedrooms
- Main Floor Bedroom
Laundry
- Laundry Room
- Dryer
- Washer
Pool
- Above Ground Pool
- Fence Around Pool
Schools
- Vassar Road Elementary School
- Wappingers Junior High School
- Roy C Ketcham Senior High Sch
Utilities
- Cooling System Mounted To A Wall/Window
- Baseboard Heating
- Natural Gas Connected
Map
Home Values in the Area
Average Home Value in this Area
Tax History
| Year | Tax Paid | Tax Assessment Tax Assessment Total Assessment is a certain percentage of the fair market value that is determined by local assessors to be the total taxable value of land and additions on the property. | Land | Improvement |
|---|---|---|---|---|
| 2024 | $9,328 | $324,000 | $75,000 | $249,000 |
| 2023 | $12,798 | $324,000 | $75,000 | $249,000 |
| 2022 | $13,317 | $324,000 | $68,100 | $255,900 |
| 2021 | $12,325 | $281,500 | $68,100 | $213,400 |
| 2020 | $8,139 | $263,000 | $68,100 | $194,900 |
| 2019 | $7,964 | $263,000 | $68,100 | $194,900 |
| 2018 | $7,444 | $232,000 | $68,100 | $163,900 |
| 2017 | $7,003 | $229,500 | $68,100 | $161,400 |
| 2016 | $6,648 | $229,500 | $68,100 | $161,400 |
| 2015 | -- | $208,500 | $72,000 | $136,500 |
| 2014 | -- | $208,500 | $72,000 | $136,500 |
Property History
| Date | Event | Price | List to Sale | Price per Sq Ft |
|---|---|---|---|---|
| 03/02/2026 03/02/26 | Pending | -- | -- | -- |
| 02/26/2026 02/26/26 | Off Market | $475,000 | -- | -- |
| 12/19/2025 12/19/25 | Price Changed | $475,000 | -4.0% | $280 / Sq Ft |
| 11/23/2025 11/23/25 | For Sale | $495,000 | -- | $292 / Sq Ft |
Purchase History
| Date | Type | Sale Price | Title Company |
|---|---|---|---|
| Deed | $255,000 | -- | |
| Deed | $180,000 | -- |
Mortgage History
| Date | Status | Loan Amount | Loan Type |
|---|---|---|---|
| Open | $251,611 | FHA |
Source: OneKey® MLS
MLS Number: 938023
APN: 134689-6159-02-992934-0000
Disclaimer: Certain information contained herein is derived from information provided by parties other than Homes.com. All information provided is deemed reliable, but is not guaranteed to be accurate and should be independently verified.
![]() The data relating to real estate for sale or lease on this web site comes in part from OneKey® MLS. Real estate listings held by brokerage firms other than Ten-X are marked with the OneKey® MLS logo or an abbreviated logo and detailed information about them includes the name of the listing broker.
The data relating to real estate for sale or lease on this web site comes in part from OneKey® MLS. Real estate listings held by brokerage firms other than Ten-X are marked with the OneKey® MLS logo or an abbreviated logo and detailed information about them includes the name of the listing broker.
Based on information submitted to the MLS GRID. All data is obtained from various sources and may not have been verified by broker or MLS GRID. Supplied Open House Information is subject to change without notice. All information should be independently reviewed and verified for accuracy. Properties may or may not be listed by the office/agent presenting the information. Some IDX listings have been excluded from this website. IDX information is provided exclusively for personal, non-commercial use, and may not be used for any purpose other than to identify prospective properties consumers may be interested in purchasing.
Information is deemed reliable but not guaranteed.
Copyright 2026 OneKey® MLS. All rights reserved.
Based on information submitted to the MLS GRID
- 3 Shelley Rd
- 104 Sutton Park Rd
- 95 Sutton Park Rd
- 98 Sutton Park Rd
- 32 Deer Run Rd
- 34 Raker Rd
- 42 Autumn Dr
- 47 Timberline Dr
- 10 Horizon Hill Dr
- 13 Timberline Dr
- 1 Benton Rd
- 4 Pleasant Ln
- 77 Colburn Dr
- 84 Hillis Terrace
- 6 Gale Dr
- 22 Carmen Dr
- 413 Vassar Rd
- 34 Brookland Farms Rd
- 4 Ridgewood Terrace
- 10 Lori St
Ask me questions while you tour the home.