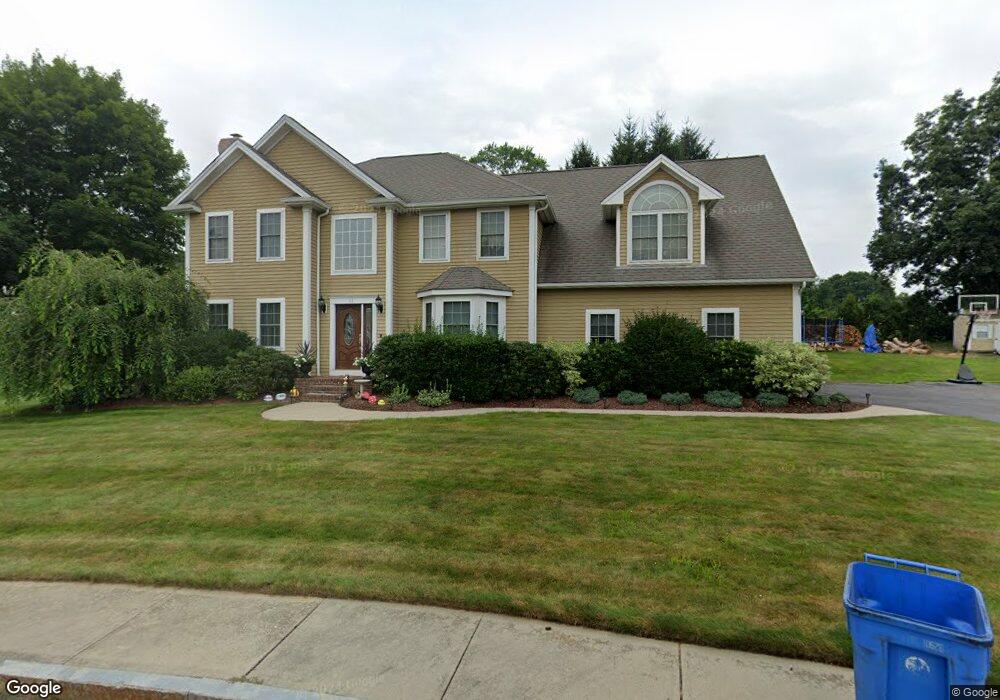
11 Lenky Dr Cumberland, RI 02864
Ashton NeighborhoodEstimated Value: $690,336 - $1,238,000
About This Home
This home is located at 11 Lenky Dr, Cumberland, RI 02864 and is currently estimated at $900,584, approximately $346 per square foot. 11 Lenky Dr is a home located in Providence County with nearby schools including Ashton Elementary School, Joseph L. McCourt Middle School, and Cumberland High School.
Ownership History
We collect this data history from publicly available records. To have your information removed, we recommend requesting removal directly through your county’s website.
Purchase Details
Home Financials for this Owner
Home Financials are based on the most recent Mortgage that was taken out on this home.Home Values in the Area
Average Home Value in this Area
Purchase History
We collect this data history from publicly available records. To have your information removed, we recommend requesting removal directly through your county’s website.
| Date | Buyer | Sale Price | Title Company |
|---|---|---|---|
| $350,000 | -- |
Mortgage History
We collect this data history from publicly available records. To have your information removed, we recommend requesting removal directly through your county’s website.
| Date | Status | Borrower | Loan Amount |
|---|---|---|---|
| Open | $110,000 | ||
| Open | $270,000 |
Tax History
We collect this data history from publicly available records. To have your information removed, we recommend requesting removal directly through your county’s website.
| Year | Tax Paid | Tax Assessment Tax Assessment Total Assessment is a certain percentage of the fair market value that is determined by local assessors to be the total taxable value of land and additions on the property. | Land | Improvement |
|---|---|---|---|---|
| 2025 | $6,899 | $562,300 | $164,800 | $397,500 |
| 2024 | $6,719 | $562,300 | $164,800 | $397,500 |
| 2023 | $6,534 | $562,300 | $164,800 | $397,500 |
| 2022 | $6,632 | $442,400 | $130,200 | $312,200 |
| 2021 | $6,521 | $442,400 | $130,200 | $312,200 |
| 2020 | $6,335 | $442,400 | $130,200 | $312,200 |
| 2019 | $6,233 | $392,500 | $111,000 | $281,500 |
| 2018 | $6,052 | $392,500 | $111,000 | $281,500 |
| 2017 | $5,970 | $392,500 | $111,000 | $281,500 |
| 2016 | $6,323 | $370,200 | $111,000 | $259,200 |
| 2015 | $6,323 | $370,200 | $111,000 | $259,200 |
| 2014 | $6,323 | $370,200 | $111,000 | $259,200 |
| 2013 | $6,066 | $384,400 | $111,000 | $273,400 |
Map
- 27 Hidden Valley Ln
- 33 Cedar Way
- 4 Kelsey Eden Way
- 1504 Hunting Hill Dr
- 1502 Hunting Hill Dr
- 164 Scott Rd
- 107 Old River Rd Unit 120
- 97 Angell Rd
- 3 Barrett St
- 1302 Hunting Hill Dr
- 699 Lower River Rd
- 185 Scott Rd
- 17 Victory St
- 8 Ledgemont Dr
- 59 Orchard Dr
- 77 Lippitt Ave
- 27 Oxford Rd
- 19 Leigh Rd
- 125 West Rd
- 51 Birch Rd
Ask me questions while you tour the home.