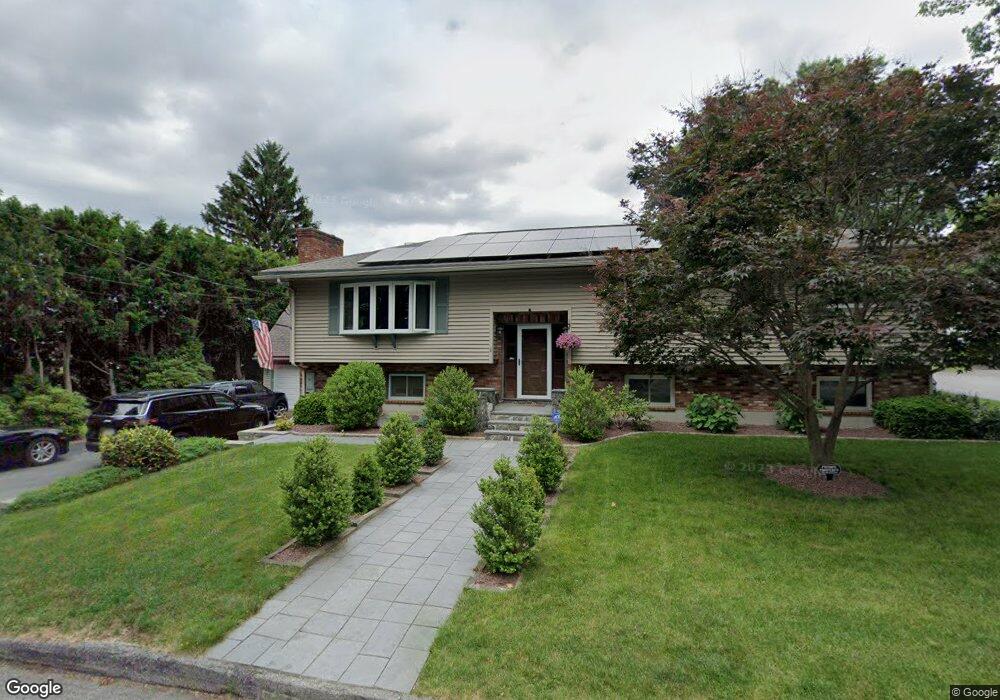
11 Lepanto St Worcester, MA 01604
Grafton Hill NeighborhoodEstimated Value: $565,000 - $652,000
4
Beds
2
Baths
1,822
Sq Ft
$337/Sq Ft
Est. Value
About This Home
This home is located at 11 Lepanto St, Worcester, MA 01604 and is currently estimated at $614,143, approximately $337 per square foot. 11 Lepanto St is a home located in Worcester County with nearby schools including Roosevelt Elementary School, Jacob Hiatt Magnet School, and Chandler Magnet.
Ownership History
Date
Name
Owned For
Owner Type
Purchase Details
Closed on
Nov 24, 2025
Sold by
Palumbo Elena
Bought by
Elena G Palumbo Ret and Palumbo
Current Estimated Value
Purchase Details
Closed on
Sep 21, 2010
Sold by
Palumbo Angelo and Palumbo Patricia K
Bought by
Palumbo Elena
Home Financials for this Owner
Home Financials are based on the most recent Mortgage that was taken out on this home.
Original Mortgage
$198,400
Interest Rate
4.51%
Mortgage Type
Purchase Money Mortgage
Create a Home Valuation Report for This Property
The Home Valuation Report is an in-depth analysis detailing your home's value as well as a comparison with similar homes in the area
Home Values in the Area
Average Home Value in this Area
Purchase History
| Date | Buyer | Sale Price | Title Company |
|---|---|---|---|
| Elena G Palumbo Ret | -- | -- | |
| Palumbo Elena | $248,000 | -- | |
| Palumbo Elena G | $248,000 | -- |
Source: Public Records
Mortgage History
| Date | Status | Borrower | Loan Amount |
|---|---|---|---|
| Previous Owner | Palumbo Elena G | $198,400 | |
| Previous Owner | Palumbo Elena | $57,000 | |
| Previous Owner | Palumbo Elena | $63,000 |
Source: Public Records
Tax History
| Year | Tax Paid | Tax Assessment Tax Assessment Total Assessment is a certain percentage of the fair market value that is determined by local assessors to be the total taxable value of land and additions on the property. | Land | Improvement |
|---|---|---|---|---|
| 2025 | $7,917 | $600,200 | $118,700 | $481,500 |
| 2024 | $7,554 | $549,400 | $118,700 | $430,700 |
| 2023 | $7,203 | $502,300 | $103,200 | $399,100 |
| 2022 | $6,987 | $459,400 | $82,600 | $376,800 |
| 2021 | $6,208 | $381,300 | $66,100 | $315,200 |
| 2020 | $5,785 | $340,300 | $66,100 | $274,200 |
| 2019 | $5,992 | $332,900 | $59,500 | $273,400 |
| 2018 | $5,838 | $308,700 | $59,500 | $249,200 |
| 2017 | $5,503 | $286,300 | $59,500 | $226,800 |
| 2016 | $5,474 | $265,600 | $43,700 | $221,900 |
| 2015 | $5,331 | $265,600 | $43,700 | $221,900 |
| 2014 | $5,190 | $265,600 | $43,700 | $221,900 |
Source: Public Records
Map
Nearby Homes
- 27 Middlesex Ave
- 21 Middlesex Ave Unit 305
- Lot B Crawford St
- 26 Progressive St
- 12 Middlesex Ave
- 74 Valmor St
- 76 Valmor St
- 360 Hamilton St
- 411B Lake Ave
- 22 Trahan Ave
- 12 Hyannis Place
- 6 Harrington Way
- 13 Pocasset St
- 28 Gordon St
- 469 Lake Ave
- 4 Ayrshire Rd
- 36 Canna Dr
- 2A Nonquit St Unit A
- 330 Sunderland Rd Unit 80
- 55 Standish St
Your Personal Tour Guide
Ask me questions while you tour the home.