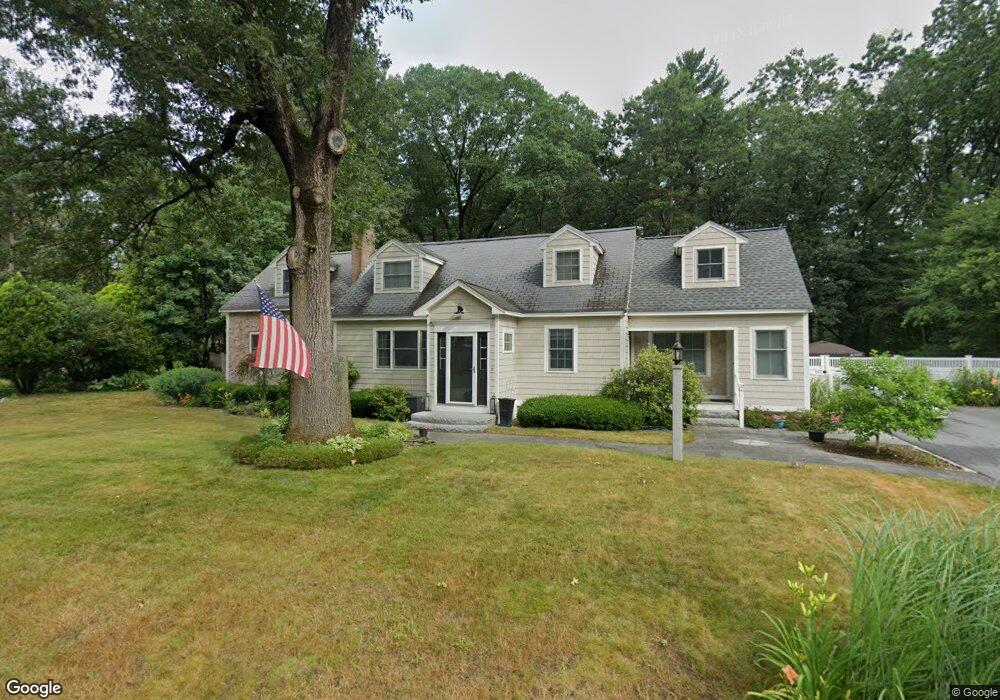
11 Lillian Rd Westford, MA 01886
Estimated Value: $615,000 - $877,000
3
Beds
3
Baths
2,814
Sq Ft
$273/Sq Ft
Est. Value
About This Home
This home is located at 11 Lillian Rd, Westford, MA 01886 and is currently estimated at $768,592, approximately $273 per square foot. 11 Lillian Rd is a home located in Middlesex County with nearby schools including Nabnasset Elementary, Abbot Elementary School, and Stony Brook School.
Ownership History
Date
Name
Owned For
Owner Type
Purchase Details
Closed on
Apr 30, 1993
Sold by
Shorey John W and Shorey Nancy J
Bought by
Mcinerney Stephen and Mcinerney Marcia
Current Estimated Value
Home Financials for this Owner
Home Financials are based on the most recent Mortgage that was taken out on this home.
Original Mortgage
$136,800
Interest Rate
7.51%
Mortgage Type
Purchase Money Mortgage
Create a Home Valuation Report for This Property
The Home Valuation Report is an in-depth analysis detailing your home's value as well as a comparison with similar homes in the area
Home Values in the Area
Average Home Value in this Area
Purchase History
| Date | Buyer | Sale Price | Title Company |
|---|---|---|---|
| Mcinerney Stephen | $152,000 | -- |
Source: Public Records
Mortgage History
| Date | Status | Borrower | Loan Amount |
|---|---|---|---|
| Open | Mcinerney Stephen | $220,000 | |
| Closed | Mcinerney Stephen | $175,000 | |
| Closed | Mcinerney Stephen | $50,000 | |
| Closed | Mcinerney Stephen | $136,800 |
Source: Public Records
Tax History
| Year | Tax Paid | Tax Assessment Tax Assessment Total Assessment is a certain percentage of the fair market value that is determined by local assessors to be the total taxable value of land and additions on the property. | Land | Improvement |
|---|---|---|---|---|
| 2025 | $10,057 | $746,600 | $303,900 | $442,700 |
| 2024 | $9,790 | $711,000 | $289,400 | $421,600 |
| 2023 | $9,508 | $644,200 | $275,700 | $368,500 |
| 2022 | $9,732 | $603,700 | $235,200 | $368,500 |
| 2021 | $9,044 | $543,500 | $235,200 | $308,300 |
| 2020 | $8,875 | $543,500 | $235,200 | $308,300 |
| 2019 | $8,461 | $510,900 | $235,200 | $275,700 |
| 2018 | $6,834 | $422,400 | $225,000 | $197,400 |
| 2017 | $39,993 | $402,400 | $225,000 | $177,400 |
| 2016 | $6,349 | $389,500 | $212,100 | $177,400 |
| 2015 | $6,176 | $380,300 | $202,900 | $177,400 |
| 2014 | $5,935 | $357,500 | $194,800 | $162,700 |
Source: Public Records
Map
Nearby Homes
- 17 York Ave
- 4 Grove St
- 4 Swanson Ln
- 17 Forrest Rd
- 8 Monument Hill Rd
- 23 Monument Hill Rd
- 427 Groton Rd
- 60 Crooked Spring Rd
- 8 Galloway Rd
- 1 Appian Way
- E41 Scotty Hollow Dr Unit E41
- 13 Long Rd
- 29 Lamplighter Ln
- 62 Main St
- 40 Grandview Rd
- 11 Big Rock Trail
- 143 Pine Hill Rd
- 360 Littleton Rd Unit B7
- 360 Littleton Rd Unit E10
- 360 Littleton Rd Unit C7
Your Personal Tour Guide
Ask me questions while you tour the home.