11 Meagher Ave Middleton, MA 01949
Estimated Value: $689,849 - $795,000
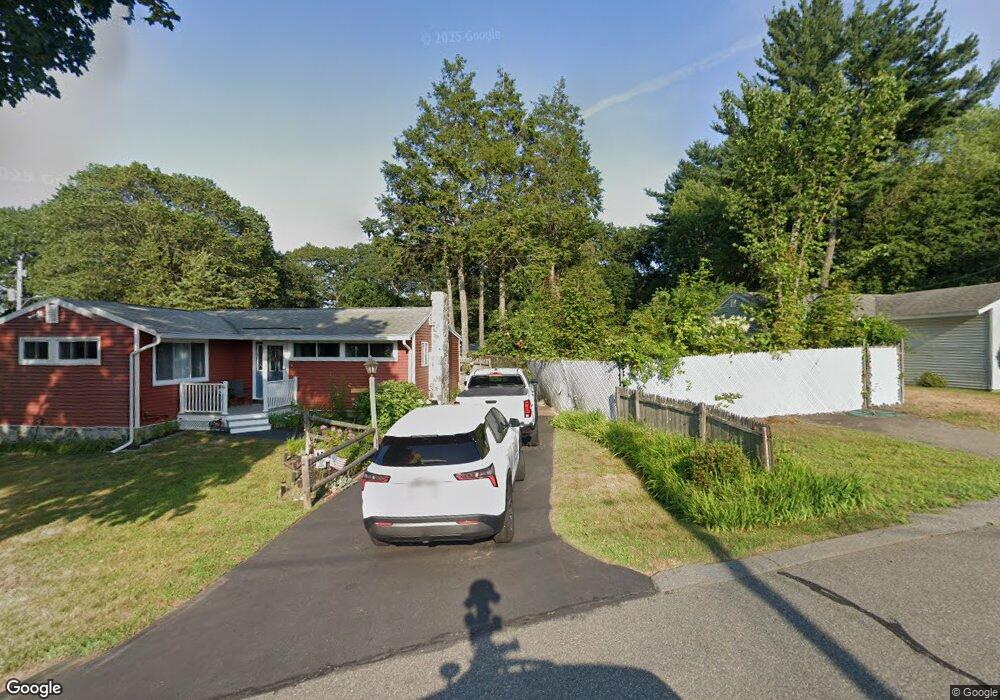
About This Home
This home is located at 11 Meagher Ave, Middleton, MA 01949 and is currently estimated at $746,212, approximately $434 per square foot. 11 Meagher Ave is a home located in Essex County with nearby schools including Howe-Manning Elementary School, Fuller Meadow Elementary School, and Masconomet Regional Middle School.
Ownership History
We collect this data history from publicly available records. To have your information removed, we recommend requesting removal directly through your county’s website.
Purchase Details
Home Financials for this Owner
Home Financials are based on the most recent Mortgage that was taken out on this home.Purchase Details
Home Values in the Area
Average Home Value in this Area
Purchase History
We collect this data history from publicly available records. To have your information removed, we recommend requesting removal directly through your county’s website.
| Date | Buyer | Sale Price | Title Company |
|---|---|---|---|
| $420,000 | -- | ||
| $420,000 | -- | ||
| $125,000 | -- | ||
| $125,000 | -- |
Mortgage History
We collect this data history from publicly available records. To have your information removed, we recommend requesting removal directly through your county’s website.
| Date | Status | Borrower | Loan Amount |
|---|---|---|---|
| Open | $128,000 | ||
| Open | $220,000 |
Tax History
We collect this data history from publicly available records. To have your information removed, we recommend requesting removal directly through your county’s website.
| Year | Tax Paid | Tax Assessment Tax Assessment Total Assessment is a certain percentage of the fair market value that is determined by local assessors to be the total taxable value of land and additions on the property. | Land | Improvement |
|---|---|---|---|---|
| 2025 | $7,077 | $595,200 | $349,900 | $245,300 |
| 2024 | $7,253 | $615,200 | $349,900 | $265,300 |
| 2023 | $7,351 | $571,200 | $392,800 | $178,400 |
| 2022 | $6,364 | $480,300 | $291,000 | $189,300 |
| 2021 | $5,971 | $435,200 | $255,800 | $179,400 |
| 2020 | $6,099 | $447,800 | $261,900 | $185,900 |
| 2019 | $5,773 | $421,700 | $252,700 | $169,000 |
| 2018 | $5,056 | $362,200 | $219,000 | $143,200 |
| 2017 | $5,251 | $376,400 | $220,600 | $155,800 |
| 2016 | $4,853 | $349,400 | $196,100 | $153,300 |
| 2015 | $4,491 | $325,900 | $196,100 | $129,800 |
Map
- 6 Phaneuf St
- 63 Rowell Ln Unit 63
- 8 Edgewood Rd
- 15 Rowell Ln Unit 15
- 111 Flint Farm Rd
- 16 Couture Way
- 7 Wedge Ct Unit 7
- 110 Flint Farm Rd
- 12 Couture Way
- 38 N Main St
- 20 1/2 Webb St Unit 2A
- 30 Spoon Way
- 20 Tarbox Ln
- 30 Brassie Way Unit 30
- 1 East St
- 43 Riverside Dr
- 19 Glen Dr
- 152 Lake St
- 11 James Coffin Way Unit 11
- 13 Highland Rd
Ask me questions while you tour the home.