11 Morris St Everett, MA 02149
Glendale NeighborhoodEstimated Value: $809,304 - $971,000
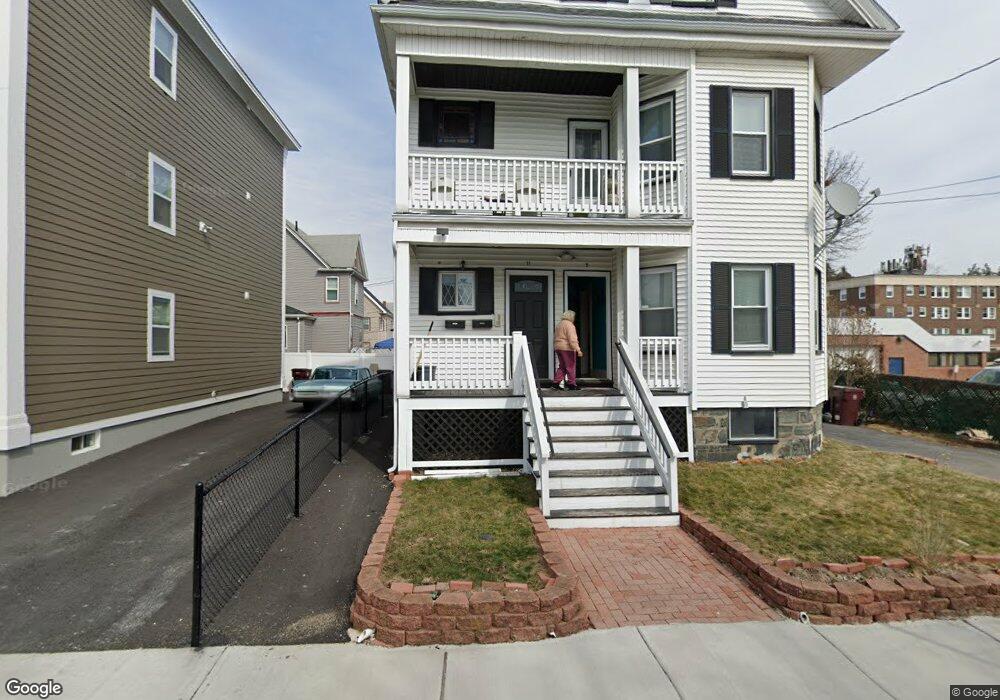
About This Home
This home is located at 11 Morris St, Everett, MA 02149 and is currently estimated at $890,826, approximately $386 per square foot. 11 Morris St is a home located in Middlesex County with nearby schools including Everett High School and Pioneer Charter School of Science.
Ownership History
We collect this data history from publicly available records. To have your information removed, we recommend requesting removal directly through your county’s website.
Purchase Details
Purchase Details
Home Financials for this Owner
Home Financials are based on the most recent Mortgage that was taken out on this home.Home Values in the Area
Average Home Value in this Area
Purchase History
We collect this data history from publicly available records. To have your information removed, we recommend requesting removal directly through your county’s website.
| Date | Buyer | Sale Price | Title Company |
|---|---|---|---|
| -- | -- | ||
| $454,000 | -- |
Mortgage History
We collect this data history from publicly available records. To have your information removed, we recommend requesting removal directly through your county’s website.
| Date | Status | Borrower | Loan Amount |
|---|---|---|---|
| Previous Owner | $363,200 |
Tax History
We collect this data history from publicly available records. To have your information removed, we recommend requesting removal directly through your county’s website.
| Year | Tax Paid | Tax Assessment Tax Assessment Total Assessment is a certain percentage of the fair market value that is determined by local assessors to be the total taxable value of land and additions on the property. | Land | Improvement |
|---|---|---|---|---|
| 2025 | $8,892 | $780,700 | $252,200 | $528,500 |
| 2024 | $8,151 | $711,300 | $224,200 | $487,100 |
| 2023 | $7,847 | $666,100 | $205,500 | $460,600 |
| 2022 | $6,444 | $622,000 | $196,100 | $425,900 |
| 2021 | $5,776 | $585,200 | $175,600 | $409,600 |
| 2020 | $5,972 | $561,300 | $175,600 | $385,700 |
| 2019 | $6,319 | $510,400 | $167,200 | $343,200 |
| 2018 | $6,175 | $448,100 | $145,700 | $302,400 |
| 2017 | $5,611 | $388,600 | $112,100 | $276,500 |
| 2016 | $5,183 | $358,700 | $112,100 | $246,600 |
| 2015 | $4,916 | $336,500 | $105,300 | $231,200 |
Map
- 20 Raymond St
- 29 Oakland Ave
- 8 Parker St Unit 5
- 8 Walnut St Unit 2
- 8 Walnut St Unit 28
- 20 Derne St
- 6 Hampshire St
- 15 Staples Ave Unit 18
- 15 Staples Ave Unit 12
- 15 Staples Ave Unit 27
- 96 Cleveland Ave
- 15 Marie Ave
- 15 Dean St
- 43-45 Shirley St
- 110 Ferry St
- 24-26 Edith Ave
- 170 Bradford St Unit 3
- 30 Chelsea St Unit 814
- 826 Broadway
- 68 Linden St Unit 49
Ask me questions while you tour the home.