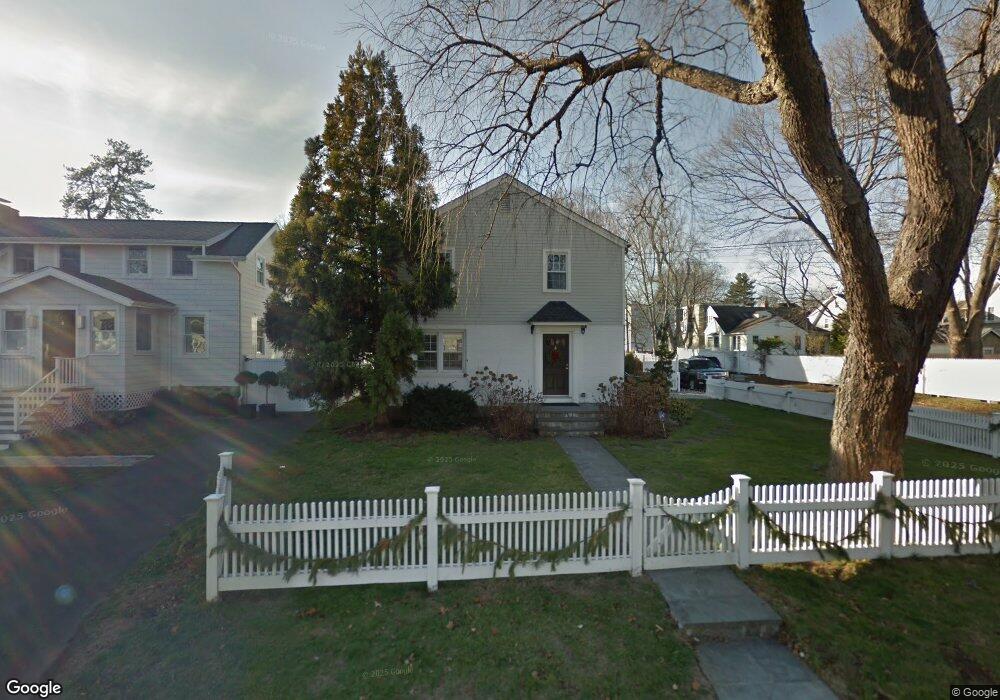
11 Mortimer Dr Old Greenwich, CT 06870
Old Greenwich NeighborhoodEstimated Value: $1,413,000 - $2,200,000
3
Beds
2
Baths
1,418
Sq Ft
$1,277/Sq Ft
Est. Value
About This Home
This home is located at 11 Mortimer Dr, Old Greenwich, CT 06870 and is currently estimated at $1,810,397, approximately $1,276 per square foot. 11 Mortimer Dr is a home located in Fairfield County with nearby schools including Old Greenwich School, Eastern Middle School, and Greenwich High School.
Ownership History
Date
Name
Owned For
Owner Type
Purchase Details
Closed on
May 2, 2007
Sold by
Brock-Zaccagnini Barbara
Bought by
Barry Michael and Barry Nicola
Current Estimated Value
Purchase Details
Closed on
Nov 13, 2003
Sold by
Constance A Hekker Rt and Hekker Kai
Bought by
Zaccagnini Barbara Brook
Create a Home Valuation Report for This Property
The Home Valuation Report is an in-depth analysis detailing your home's value as well as a comparison with similar homes in the area
Home Values in the Area
Average Home Value in this Area
Purchase History
We collect this data history from publicly available records. To have your information removed, we recommend requesting removal directly through your county’s website.
| Date | Buyer | Sale Price | Title Company |
|---|---|---|---|
| Barry Michael | $965,000 | -- | |
| Zaccagnini Barbara Brook | $650,000 | -- |
Source: Public Records
Mortgage History
We collect this data history from publicly available records. To have your information removed, we recommend requesting removal directly through your county’s website.
| Date | Status | Borrower | Loan Amount |
|---|---|---|---|
| Open | Zaccagnini Barbara Brook | $1,085,000 | |
| Closed | Zaccagnini Barbara Brook | $1,050,000 |
Source: Public Records
Tax History
| Year | Tax Paid | Tax Assessment Tax Assessment Total Assessment is a certain percentage of the fair market value that is determined by local assessors to be the total taxable value of land and additions on the property. | Land | Improvement |
|---|---|---|---|---|
| 2025 | $10,383 | $840,140 | $668,990 | $171,150 |
| 2024 | $10,028 | $840,140 | $668,990 | $171,150 |
| 2023 | $9,776 | $840,140 | $668,990 | $171,150 |
| 2022 | $9,687 | $840,140 | $668,990 | $171,150 |
| 2021 | $8,697 | $722,330 | $556,990 | $165,340 |
| 2020 | $8,682 | $722,330 | $556,990 | $165,340 |
| 2019 | $8,769 | $722,330 | $556,990 | $165,340 |
| 2018 | $8,574 | $722,330 | $556,990 | $165,340 |
| 2017 | $8,682 | $722,330 | $556,990 | $165,340 |
| 2016 | $8,740 | $738,850 | $556,990 | $181,860 |
| 2015 | $8,167 | $688,450 | $557,410 | $131,040 |
| 2014 | $7,044 | $605,920 | $557,410 | $48,510 |
Source: Public Records
Map
Nearby Homes
Your Personal Tour Guide
Ask me questions while you tour the home.