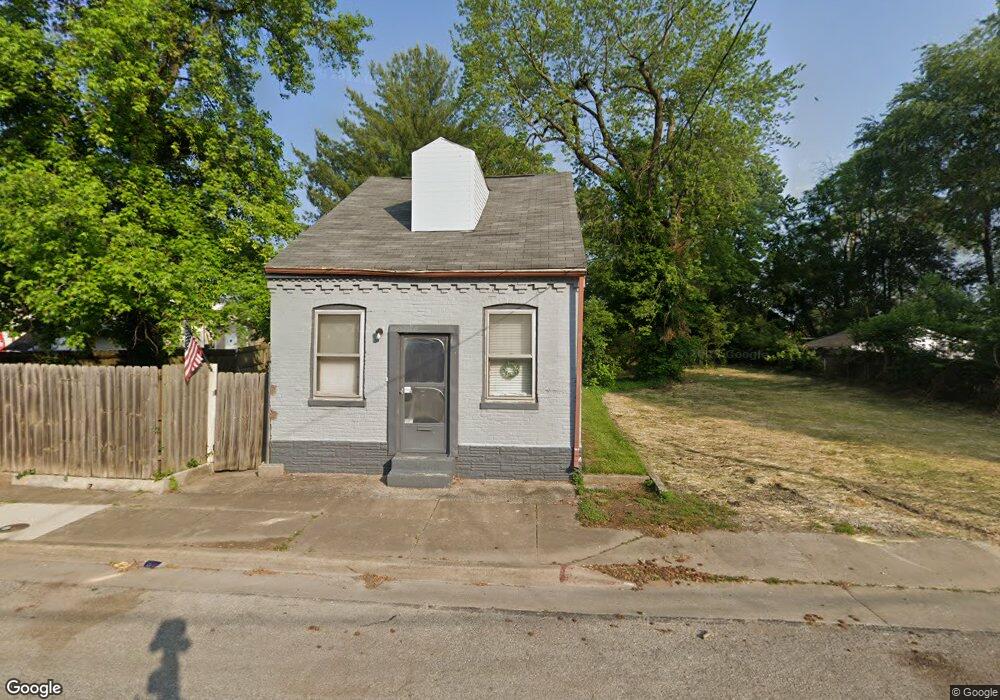
11 N 15th St Belleville, IL 62220
Estimated Value: $78,000 - $92,000
Studio
--
Bath
594
Sq Ft
$145/Sq Ft
Est. Value
About This Home
This home is located at 11 N 15th St, Belleville, IL 62220 and is currently estimated at $86,109, approximately $144 per square foot. 11 N 15th St is a home located in St. Clair County with nearby schools including Union Elementary School, West Jr High School, and Governor French Academy.
Ownership History
Date
Name
Owned For
Owner Type
Purchase Details
Closed on
May 14, 2015
Sold by
Jackson Patricia Ann
Bought by
Jackson Hollis E and Hollis E Jackson Declaration Of Trust
Current Estimated Value
Purchase Details
Closed on
Jan 10, 2005
Sold by
Jackson Hollis E
Bought by
Hillsman Anthony H and Lucas Arnella G
Home Financials for this Owner
Home Financials are based on the most recent Mortgage that was taken out on this home.
Original Mortgage
$34,400
Interest Rate
7%
Mortgage Type
Seller Take Back
Create a Home Valuation Report for This Property
The Home Valuation Report is an in-depth analysis detailing your home's value as well as a comparison with similar homes in the area
Home Values in the Area
Average Home Value in this Area
Purchase History
| Date | Buyer | Sale Price | Title Company |
|---|---|---|---|
| Jackson Hollis E | -- | Attorney | |
| Hillsman Anthony H | $43,000 | Accommodation | |
| Hillsman Anthony H | $43,000 | -- |
Source: Public Records
Mortgage History
| Date | Status | Borrower | Loan Amount |
|---|---|---|---|
| Previous Owner | Hillsman Anthony H | $34,400 |
Source: Public Records
Tax History
| Year | Tax Paid | Tax Assessment Tax Assessment Total Assessment is a certain percentage of the fair market value that is determined by local assessors to be the total taxable value of land and additions on the property. | Land | Improvement |
|---|---|---|---|---|
| 2024 | $1,254 | $27,261 | $2,845 | $24,416 |
| 2023 | $1,165 | $25,408 | $2,789 | $22,619 |
| 2022 | $945 | $22,874 | $2,511 | $20,363 |
| 2021 | $812 | $21,146 | $2,321 | $18,825 |
| 2020 | $1,240 | $19,997 | $2,195 | $17,802 |
| 2019 | $2,199 | $21,223 | $2,198 | $19,025 |
| 2018 | $2,150 | $20,764 | $2,150 | $18,614 |
| 2017 | $2,133 | $20,618 | $2,135 | $18,483 |
| 2016 | $2,106 | $20,180 | $2,090 | $18,090 |
| 2014 | $2,094 | $22,648 | $3,688 | $18,960 |
| 2013 | -- | $22,972 | $3,741 | $19,231 |
Source: Public Records
Map
Nearby Homes
Your Personal Tour Guide
Ask me questions while you tour the home.