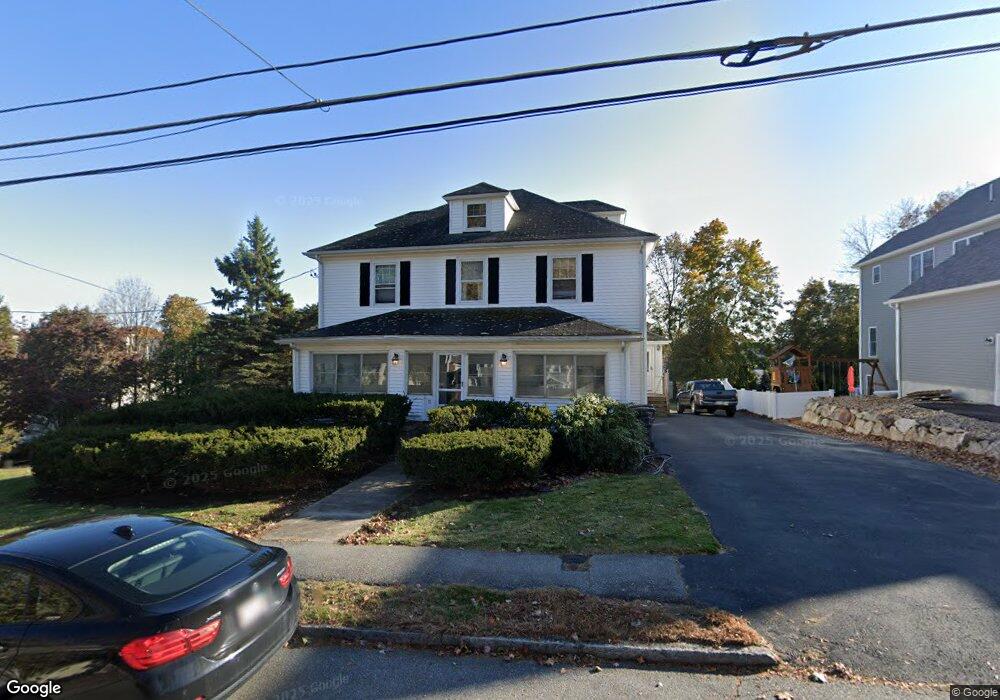
11 Newbridge Ave Woburn, MA 01801
North Woburn NeighborhoodEstimated Value: $740,000 - $868,000
5
Beds
2
Baths
2,112
Sq Ft
$378/Sq Ft
Est. Value
About This Home
This home is located at 11 Newbridge Ave, Woburn, MA 01801 and is currently estimated at $798,852, approximately $378 per square foot. 11 Newbridge Ave is a home located in Middlesex County with nearby schools including Linscott-Rumford Elementary School, John F. Kennedy Middle School, and Woburn High School.
Ownership History
Date
Name
Owned For
Owner Type
Purchase Details
Closed on
Feb 28, 2022
Sold by
Fumicello Michael and Fumicello Kathleen A
Bought by
Fumicello Ft and Fumicello
Current Estimated Value
Purchase Details
Closed on
Oct 11, 1988
Sold by
Nicholson Athens
Bought by
Fumicello Michael
Home Financials for this Owner
Home Financials are based on the most recent Mortgage that was taken out on this home.
Original Mortgage
$100,000
Interest Rate
10.64%
Mortgage Type
Purchase Money Mortgage
Create a Home Valuation Report for This Property
The Home Valuation Report is an in-depth analysis detailing your home's value as well as a comparison with similar homes in the area
Home Values in the Area
Average Home Value in this Area
Purchase History
We collect this data history from publicly available records. To have your information removed, we recommend requesting removal directly through your county’s website.
| Date | Buyer | Sale Price | Title Company |
|---|---|---|---|
| Fumicello Ft | -- | None Available | |
| Fumicello Ft | -- | None Available | |
| Fumicello Michael | $190,500 | -- |
Source: Public Records
Mortgage History
We collect this data history from publicly available records. To have your information removed, we recommend requesting removal directly through your county’s website.
| Date | Status | Borrower | Loan Amount |
|---|---|---|---|
| Previous Owner | Fumicello Michael | $161,500 | |
| Previous Owner | Fumicello Michael | $26,000 | |
| Previous Owner | Fumicello Michael | $115,000 | |
| Previous Owner | Fumicello Michael | $100,000 |
Source: Public Records
Tax History
| Year | Tax Paid | Tax Assessment Tax Assessment Total Assessment is a certain percentage of the fair market value that is determined by local assessors to be the total taxable value of land and additions on the property. | Land | Improvement |
|---|---|---|---|---|
| 2025 | $5,777 | $676,500 | $337,500 | $339,000 |
| 2024 | $5,130 | $636,500 | $321,500 | $315,000 |
| 2023 | $5,159 | $593,000 | $292,300 | $300,700 |
| 2022 | $4,946 | $529,600 | $254,500 | $275,100 |
| 2021 | $4,532 | $485,700 | $242,500 | $243,200 |
| 2020 | $4,512 | $484,100 | $242,500 | $241,600 |
| 2019 | $4,457 | $469,200 | $231,100 | $238,100 |
| 2018 | $4,227 | $427,400 | $212,200 | $215,200 |
| 2017 | $4,004 | $402,800 | $202,300 | $200,500 |
| 2016 | $3,818 | $379,900 | $189,200 | $190,700 |
| 2015 | $3,673 | $361,200 | $177,000 | $184,200 |
| 2014 | $3,599 | $344,700 | $177,000 | $167,700 |
Source: Public Records
Map
Nearby Homes
- 23 Ward St
- 4 Mostika Rd
- 8 Alfred Place
- 1 Arbor Ct Unit 1
- 9 Fisher Terrace
- 3 Georgia Dr
- 41 Mountain St Unit 41
- 82 Lowell St
- 83 Merrimac St
- 14 Forest Park Rd
- 6 Cooley Dr Unit 6
- 17 Cronin Way
- 106 Mishawum Rd
- 159 Mishawum Rd
- 0 Fryeburg Rd
- 0 Johnson Rd
- 148 Wyman St Unit 148
- 11 Rose Farm Ln
- 12 Linden St
- 3 Elizabeth Ave
- 7 Newbridge Ave
- 9 Newbridge Ave
- 3 Newbridge Ave
- 6 Patricia Cir
- 41 Elm St
- 8 Newbridge Ave
- 10 Newbridge Ave
- 43 Elm St
- 12 Newbridge Ave
- 7 Patricia Cir
- 6 Newbridge Ave
- 15 Newbridge Ave
- 31 Elm St
- 14 Newbridge Ave
- 4 Patricia Cir
- 45 Elm St
- 45 Elm St Unit 45
- 45 Elm St Unit A
- 45 Elm St Unit 1
- 16 Newbridge Ave
Your Personal Tour Guide
Ask me questions while you tour the home.