11 Nickerson St Pawtucket, RI 02860
Downtown Pawtucket NeighborhoodEstimated Value: $377,239 - $403,000
About This Home
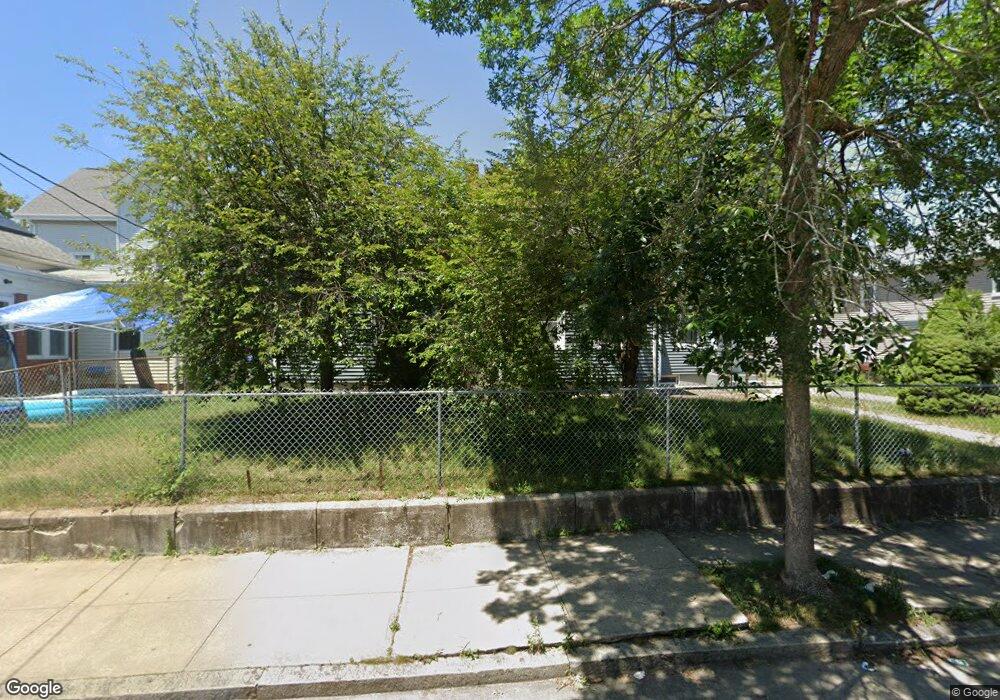
This home is located at 11 Nickerson St, Pawtucket, RI 02860 and is currently estimated at $394,310, approximately $198 per square foot. 11 Nickerson St is a home located in Providence County with nearby schools including Central Falls Senior High School and Blackstone Valley Prep Junior High School.
Ownership History
We collect this data history from publicly available records. To have your information removed, we recommend requesting removal directly through your county’s website.
Purchase Details
Home Financials for this Owner
Home Financials are based on the most recent Mortgage that was taken out on this home.Purchase Details
Purchase Details
Home Financials for this Owner
Home Financials are based on the most recent Mortgage that was taken out on this home.Purchase Details
Purchase Details
Home Values in the Area
Average Home Value in this Area
Purchase History
We collect this data history from publicly available records. To have your information removed, we recommend requesting removal directly through your county’s website.
| Date | Buyer | Sale Price | Title Company |
|---|---|---|---|
| -- | None Available | ||
| -- | None Available | ||
| $1,895 | -- | ||
| $230,000 | -- | ||
| $73,000 | -- | ||
| $1,895 | -- | ||
| $230,000 | -- | ||
| $73,000 | -- | ||
| $89,000 | -- |
Mortgage History
We collect this data history from publicly available records. To have your information removed, we recommend requesting removal directly through your county’s website.
| Date | Status | Borrower | Loan Amount |
|---|---|---|---|
| Open | $220,000 | ||
| Closed | $220,000 | ||
| Previous Owner | $230,000 |
Tax History
We collect this data history from publicly available records. To have your information removed, we recommend requesting removal directly through your county’s website.
| Year | Tax Paid | Tax Assessment Tax Assessment Total Assessment is a certain percentage of the fair market value that is determined by local assessors to be the total taxable value of land and additions on the property. | Land | Improvement |
|---|---|---|---|---|
| 2025 | $3,757 | $285,700 | $89,600 | $196,100 |
| 2024 | $3,526 | $285,700 | $89,600 | $196,100 |
| 2023 | $3,405 | $201,000 | $39,100 | $161,900 |
| 2022 | $3,333 | $201,000 | $39,100 | $161,900 |
| 2021 | $3,333 | $201,000 | $39,100 | $161,900 |
| 2020 | $3,409 | $163,200 | $48,900 | $114,300 |
| 2019 | $3,409 | $163,200 | $48,900 | $114,300 |
| 2018 | $3,285 | $163,200 | $48,900 | $114,300 |
| 2017 | $3,194 | $140,600 | $43,200 | $97,400 |
| 2016 | $3,078 | $140,600 | $43,200 | $97,400 |
Map
- 112 Clay St
- 78 Jenks St
- 140 Dexter St
- 404 Roosevelt Ave Unit 204G
- 35 Rand St
- 517 High St
- 511 High St
- 28 Bayley St Unit 301
- 28 Bayley St Unit 107
- 28 Bayley St Unit 406
- 2 King St
- 113 Summer St
- 50 Garfield St
- 30 Foundry St Unit 5
- 300 Front St Unit 105
- 300 Front St Unit 512
- 139 Broadway
- 66 Perry St
- 72 Sylvian St
- 171 Pine St
Ask me questions while you tour the home.