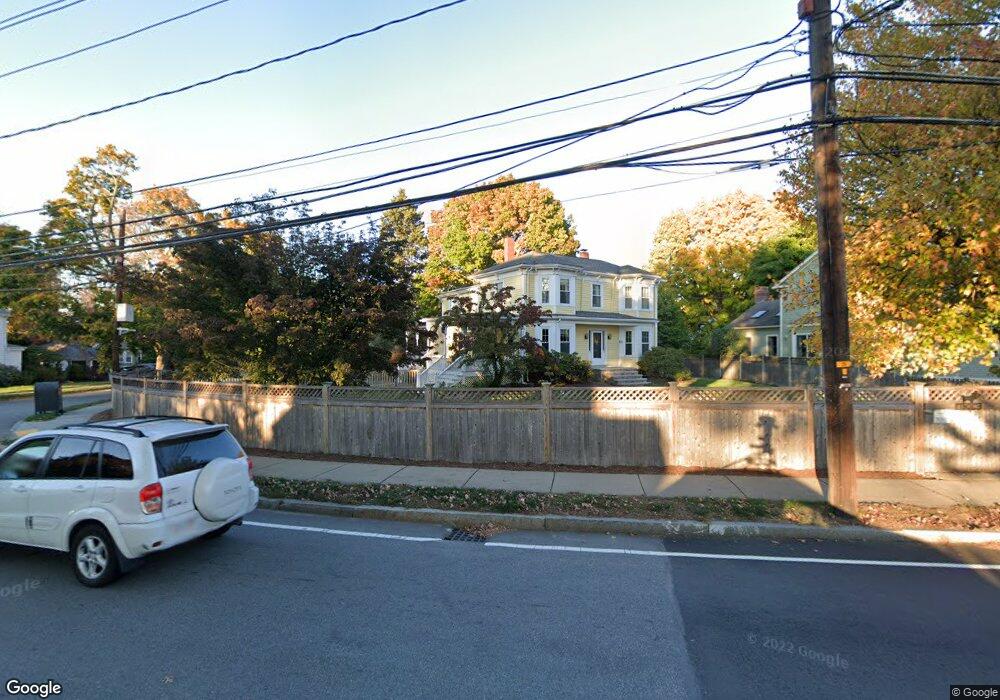
11 North St Newton, MA 02459
Nonantum NeighborhoodEstimated Value: $1,389,000 - $1,750,570
4
Beds
4
Baths
2,999
Sq Ft
$528/Sq Ft
Est. Value
About This Home
This home is located at 11 North St, Newton, MA 02459 and is currently estimated at $1,582,143, approximately $527 per square foot. 11 North St is a home located in Middlesex County with nearby schools including Horace Mann Elementary School, F.A. Day Middle School, and Newton North High School.
Ownership History
Date
Name
Owned For
Owner Type
Purchase Details
Closed on
Nov 22, 2025
Sold by
Kolodney Jeff A and Tabenken Marcia A
Bought by
Jeff Kolodney 2021 Ret and Kolodney
Current Estimated Value
Purchase Details
Closed on
Jan 28, 2000
Sold by
North Shore Constr
Bought by
Tabenken Marcia A and Kolodney Jeff A
Home Financials for this Owner
Home Financials are based on the most recent Mortgage that was taken out on this home.
Original Mortgage
$363,200
Interest Rate
7.83%
Mortgage Type
Purchase Money Mortgage
Purchase Details
Closed on
Jul 16, 1999
Sold by
Burkinshaw Robert W and Burkinshaw Collette S
Bought by
North Shore Constr Dev
Home Financials for this Owner
Home Financials are based on the most recent Mortgage that was taken out on this home.
Original Mortgage
$656,000
Interest Rate
7.39%
Mortgage Type
Purchase Money Mortgage
Create a Home Valuation Report for This Property
The Home Valuation Report is an in-depth analysis detailing your home's value as well as a comparison with similar homes in the area
Home Values in the Area
Average Home Value in this Area
Purchase History
| Date | Buyer | Sale Price | Title Company |
|---|---|---|---|
| Jeff Kolodney 2021 Ret | -- | -- | |
| Tabenken Marcia A | $454,000 | -- | |
| North Shore Constr Dev | $580,000 | -- |
Source: Public Records
Mortgage History
| Date | Status | Borrower | Loan Amount |
|---|---|---|---|
| Previous Owner | North Shore Constr Dev | $310,000 | |
| Previous Owner | North Shore Constr Dev | $363,200 | |
| Previous Owner | North Shore Constr Dev | $656,000 |
Source: Public Records
Tax History
| Year | Tax Paid | Tax Assessment Tax Assessment Total Assessment is a certain percentage of the fair market value that is determined by local assessors to be the total taxable value of land and additions on the property. | Land | Improvement |
|---|---|---|---|---|
| 2025 | $14,056 | $1,434,300 | $863,600 | $570,700 |
| 2024 | $13,591 | $1,392,500 | $838,400 | $554,100 |
| 2023 | $12,806 | $1,258,000 | $648,500 | $609,500 |
| 2022 | $12,254 | $1,164,800 | $600,500 | $564,300 |
| 2021 | $11,824 | $1,098,900 | $566,500 | $532,400 |
| 2020 | $11,473 | $1,098,900 | $566,500 | $532,400 |
| 2019 | $11,149 | $1,066,900 | $550,000 | $516,900 |
| 2018 | $10,591 | $978,800 | $494,100 | $484,700 |
| 2017 | $10,268 | $923,400 | $466,100 | $457,300 |
| 2016 | $9,821 | $863,000 | $435,600 | $427,400 |
| 2015 | $9,363 | $806,500 | $407,100 | $399,400 |
Source: Public Records
Map
Nearby Homes
- 12 Fessenden St
- 581 California St
- 105-107 Warwick Rd
- 29 Thaxter Rd
- 611 Watertown St Unit 14
- 189 Linwood Ave Unit 1
- 148 Waltham St
- 11 Bunker Ln
- 51 Farwell St
- 712 Watertown St
- 710 Watertown St Unit 712
- 76 Taft Ave
- 76 Taft Ave Unit 2
- 76 Taft Ave Unit 1
- 4 Repton Cir Unit 4105
- 98 Cherry St
- 70 Walker St Unit 1
- 338 Nevada St Unit 338
- 53-55 N Gate Park
- 16 Omar Terrace
Your Personal Tour Guide
Ask me questions while you tour the home.