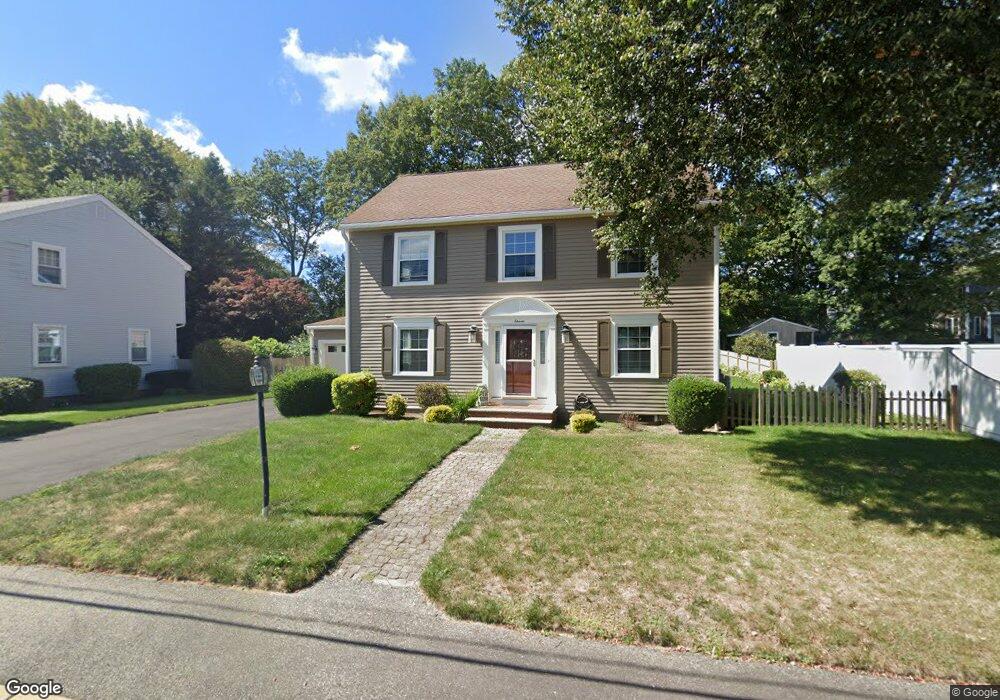
11 Olofson St Braintree, MA 02184
Braintree Highlands NeighborhoodEstimated Value: $929,619 - $1,068,000
3
Beds
3
Baths
2,924
Sq Ft
$343/Sq Ft
Est. Value
About This Home
This home is located at 11 Olofson St, Braintree, MA 02184 and is currently estimated at $1,002,405, approximately $342 per square foot. 11 Olofson St is a home located in Norfolk County with nearby schools including Braintree High School, Boston Higashi School, and Lighthouse Baptist Christian Academy.
Ownership History
Date
Name
Owned For
Owner Type
Purchase Details
Closed on
Feb 12, 2025
Sold by
Stack Marilyn F
Bought by
Stack Ft and Stack
Current Estimated Value
Purchase Details
Closed on
Dec 12, 2016
Sold by
Stack Marilyn F and Stack Robert M
Bought by
Stack Marilyn F
Purchase Details
Closed on
Jun 17, 1984
Bought by
Stack Robert M and Stack Marilyn F
Create a Home Valuation Report for This Property
The Home Valuation Report is an in-depth analysis detailing your home's value as well as a comparison with similar homes in the area
Home Values in the Area
Average Home Value in this Area
Purchase History
| Date | Buyer | Sale Price | Title Company |
|---|---|---|---|
| Stack Ft | -- | None Available | |
| Stack Marilyn F | -- | -- | |
| Stack Robert M | $82,000 | -- |
Source: Public Records
Mortgage History
| Date | Status | Borrower | Loan Amount |
|---|---|---|---|
| Previous Owner | Stack Robert M | $225,000 | |
| Previous Owner | Stack Robert M | $63,000 | |
| Previous Owner | Stack Robert M | $62,300 |
Source: Public Records
Tax History
| Year | Tax Paid | Tax Assessment Tax Assessment Total Assessment is a certain percentage of the fair market value that is determined by local assessors to be the total taxable value of land and additions on the property. | Land | Improvement |
|---|---|---|---|---|
| 2025 | $8,160 | $817,600 | $362,700 | $454,900 |
| 2024 | $7,244 | $764,100 | $329,300 | $434,800 |
| 2023 | $6,909 | $707,900 | $295,900 | $412,000 |
| 2022 | $6,759 | $679,300 | $267,300 | $412,000 |
| 2021 | $6,275 | $630,700 | $241,500 | $389,200 |
| 2020 | $6,002 | $608,700 | $219,500 | $389,200 |
| 2019 | $5,622 | $557,200 | $210,000 | $347,200 |
| 2018 | $5,527 | $524,400 | $190,900 | $333,500 |
| 2017 | $5,384 | $501,300 | $181,400 | $319,900 |
| 2016 | $5,198 | $473,400 | $171,800 | $301,600 |
| 2015 | $4,798 | $433,400 | $143,200 | $290,200 |
| 2014 | $4,650 | $407,200 | $137,500 | $269,700 |
Source: Public Records
Map
Nearby Homes
- 1696 Liberty St
- 20 Albee Dr
- 67 Park Ave
- 7 Arbutus Ave
- 1579 Washington St
- 73 Bradford Commons Ln
- 107 Bradford Commons Ln Unit 107
- 20 Teaberry Ln Unit 1
- 203 Allerton Commons Ln
- 324 Tilden Commons Ln
- 117 Pine St
- 4 Park Dr
- 9 Sunset Ave
- 257 Allerton Commons Ln
- 32 Elm Ave
- 154 Birch St
- 107 Meadow Ln Unit 107
- 288 Weymouth St
- 12 Brewster Rd
- 5 Clarendon Cir Unit Lot 4
Your Personal Tour Guide
Ask me questions while you tour the home.