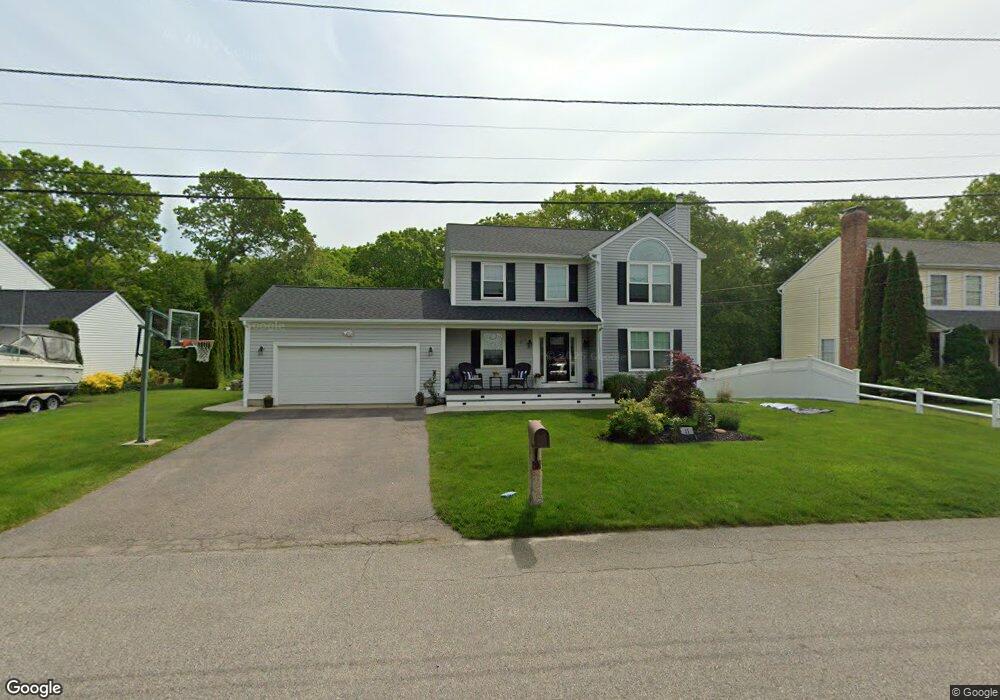
11 Red Brook Dr Westerly, RI 02891
Estimated Value: $665,997 - $803,000
About This Home
This home is located at 11 Red Brook Dr, Westerly, RI 02891 and is currently estimated at $719,249, approximately $425 per square foot. 11 Red Brook Dr is a home located in Washington County with nearby schools including Westerly High School and St. Michael School.
Ownership History
We collect this data history from publicly available records. To have your information removed, we recommend requesting removal directly through your county’s website.
Purchase Details
Home Financials for this Owner
Home Financials are based on the most recent Mortgage that was taken out on this home.Purchase Details
Purchase Details
Purchase Details
Home Values in the Area
Average Home Value in this Area
Purchase History
We collect this data history from publicly available records. To have your information removed, we recommend requesting removal directly through your county’s website.
| Date | Buyer | Sale Price | Title Company |
|---|---|---|---|
| $40,000 | -- | ||
| $355,000 | -- | ||
| $240,000 | -- | ||
| $180,000 | -- | ||
| $161,000 | -- |
Mortgage History
We collect this data history from publicly available records. To have your information removed, we recommend requesting removal directly through your county’s website.
| Date | Status | Borrower | Loan Amount |
|---|---|---|---|
| Closed | $337,300 | ||
| Closed | $336,000 | ||
| Closed | $56,200 | ||
| Closed | $334,444 | ||
| Closed | $340,000 | ||
| Closed | $52,000 | ||
| Closed | $230,600 |
Tax History
We collect this data history from publicly available records. To have your information removed, we recommend requesting removal directly through your county’s website.
| Year | Tax Paid | Tax Assessment Tax Assessment Total Assessment is a certain percentage of the fair market value that is determined by local assessors to be the total taxable value of land and additions on the property. | Land | Improvement |
|---|---|---|---|---|
| 2025 | $3,925 | $552,100 | $216,400 | $335,700 |
| 2024 | $4,098 | $417,700 | $154,600 | $263,100 |
| 2023 | $4,018 | $417,700 | $154,600 | $263,100 |
| 2022 | $3,993 | $417,700 | $154,600 | $263,100 |
| 2021 | $4,019 | $348,900 | $134,400 | $214,500 |
| 2020 | $3,946 | $348,900 | $134,400 | $214,500 |
| 2019 | $3,908 | $348,900 | $134,400 | $214,500 |
| 2018 | $3,632 | $305,700 | $124,100 | $181,600 |
| 2017 | $3,543 | $305,700 | $124,100 | $181,600 |
| 2016 | $3,571 | $305,700 | $124,100 | $181,600 |
| 2015 | $3,470 | $320,700 | $137,200 | $183,500 |
| 2014 | $3,412 | $320,700 | $137,200 | $183,500 |
Map
- 167 Winnapaug Rd
- 35 Post Rd
- 16 Abbey Ln Unit 17
- 24 Abbey Ln Unit 13
- 9 Newbury Dr
- 6 S Essex Dr
- 82 Wells St
- 121 Winnapaug Rd
- 18 No Bottom Ridge Ridge
- 34 Lanphere Rd
- 13 No Bottom Ridge Rd
- 9 Compass Way Unit 302
- 1 Compass Way Unit A103
- 68 Beach St
- 174 River Rd
- 25 Meadow Lark Dr
- 30 Wicklow Rd
- 23 Summertime Cir
- 32 Summertime Cir
- 97 River Rd
Ask me questions while you tour the home.