11 Smith St East Hampton, CT 06424
Estimated Value: $428,936 - $524,000
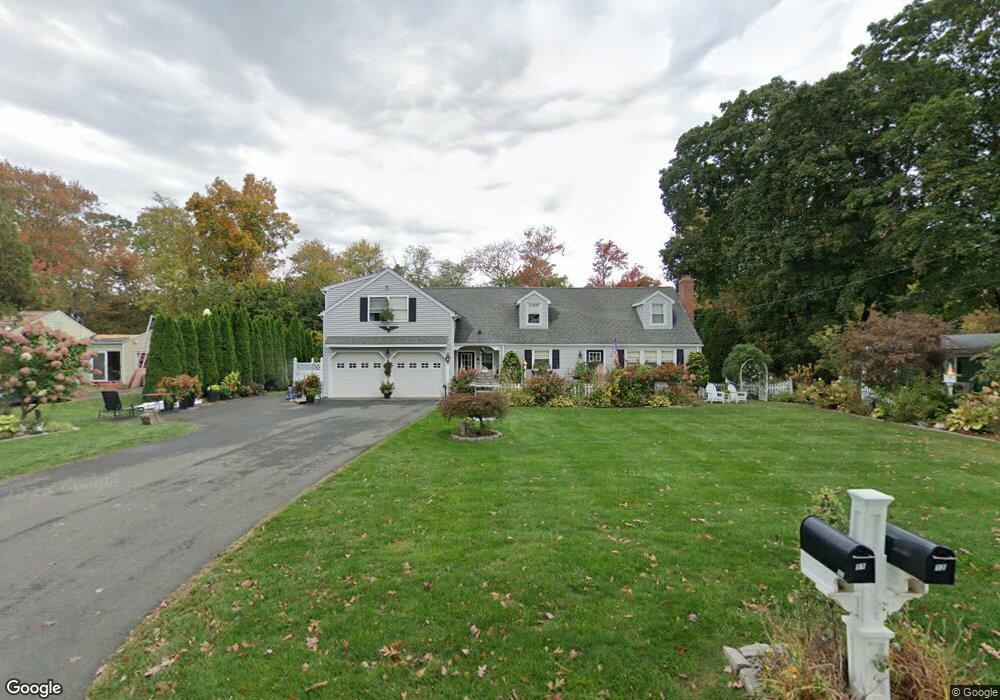
About This Home
This home is located at 11 Smith St, East Hampton, CT 06424 and is currently estimated at $476,234, approximately $207 per square foot. 11 Smith St is a home located in Middlesex County with nearby schools including Memorial School, Center Elementary School, and East Hampton Middle School.
Ownership History
We collect this data history from publicly available records. To have your information removed, we recommend requesting removal directly through your county’s website.
Purchase Details
Purchase Details
Home Financials for this Owner
Home Financials are based on the most recent Mortgage that was taken out on this home.Home Values in the Area
Average Home Value in this Area
Purchase History
We collect this data history from publicly available records. To have your information removed, we recommend requesting removal directly through your county’s website.
| Date | Buyer | Sale Price | Title Company |
|---|---|---|---|
| -- | -- | ||
| -- | -- | ||
| $140,000 | -- | ||
| $140,000 | -- |
Mortgage History
We collect this data history from publicly available records. To have your information removed, we recommend requesting removal directly through your county’s website.
| Date | Status | Borrower | Loan Amount |
|---|---|---|---|
| Previous Owner | $127,000 |
Tax History
We collect this data history from publicly available records. To have your information removed, we recommend requesting removal directly through your county’s website.
| Year | Tax Paid | Tax Assessment Tax Assessment Total Assessment is a certain percentage of the fair market value that is determined by local assessors to be the total taxable value of land and additions on the property. | Land | Improvement |
|---|---|---|---|---|
| 2025 | $6,550 | $164,950 | $42,040 | $122,910 |
| 2024 | $6,275 | $164,950 | $42,040 | $122,910 |
| 2023 | $5,948 | $164,950 | $42,040 | $122,910 |
| 2022 | $5,717 | $164,950 | $42,040 | $122,910 |
| 2021 | $5,696 | $164,950 | $42,040 | $122,910 |
| 2020 | $5,538 | $167,100 | $41,300 | $125,800 |
| 2019 | $5,770 | $174,120 | $44,250 | $129,870 |
| 2018 | $5,453 | $174,120 | $44,250 | $129,870 |
| 2017 | $5,453 | $174,120 | $44,250 | $129,870 |
| 2016 | $5,126 | $174,120 | $44,250 | $129,870 |
| 2015 | $5,196 | $187,040 | $56,390 | $130,650 |
| 2014 | $4,521 | $187,040 | $56,390 | $130,650 |
Map
- 40 Chatham Fields Rd
- 119 Main St
- 82 Main St
- 235 Middle Haddam Rd
- 16 Tall Wood Dr
- 159 Bear Swamp Rd
- 201 Edgewater Cir Unit B
- 14 Main St
- 97 Collie Brook Rd
- 91-A Flatbrook Rd Unit 91
- 103 Lake Vista Dr Unit 103
- 606 Lake Vista Dr Unit 606
- 15 Beechcrest Dr
- 5 Beechcrest Dr
- 2 Town Line Dr
- 15 Spice Hill Dr
- 6 North Hollow
- 31 N Maple St
- 53 Meeks Point Rd
- 17 Markham Rd
Ask me questions while you tour the home.