11 Smith St Middleboro, MA 02346
Estimated Value: $647,000 - $747,000
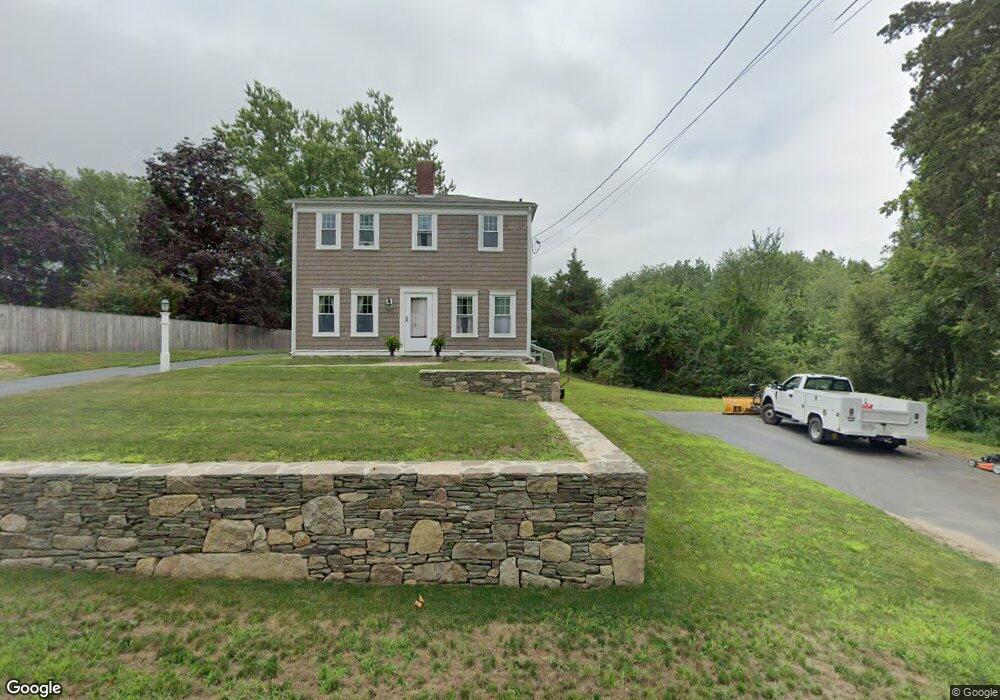
About This Home
This home is located at 11 Smith St, Middleboro, MA 02346 and is currently estimated at $694,633, approximately $305 per square foot. 11 Smith St is a home located in Plymouth County with nearby schools including Mary K. Goode Elementary School and Samuel Fuller School.
Ownership History
We collect this data history from publicly available records. To have your information removed, we recommend requesting removal directly through your county’s website.
Purchase Details
Home Financials for this Owner
Home Financials are based on the most recent Mortgage that was taken out on this home.Purchase Details
Home Values in the Area
Average Home Value in this Area
Purchase History
We collect this data history from publicly available records. To have your information removed, we recommend requesting removal directly through your county’s website.
| Date | Buyer | Sale Price | Title Company |
|---|---|---|---|
| $315,000 | -- | ||
| $171,500 | -- |
Mortgage History
We collect this data history from publicly available records. To have your information removed, we recommend requesting removal directly through your county’s website.
| Date | Status | Borrower | Loan Amount |
|---|---|---|---|
| Open | $60,000 | ||
| Open | $241,000 | ||
| Closed | $236,250 |
Tax History
We collect this data history from publicly available records. To have your information removed, we recommend requesting removal directly through your county’s website.
| Year | Tax Paid | Tax Assessment Tax Assessment Total Assessment is a certain percentage of the fair market value that is determined by local assessors to be the total taxable value of land and additions on the property. | Land | Improvement |
|---|---|---|---|---|
| 2025 | $8,503 | $634,100 | $164,200 | $469,900 |
| 2024 | $7,224 | $533,500 | $156,400 | $377,100 |
| 2023 | $6,230 | $437,500 | $156,400 | $281,100 |
| 2022 | $6,260 | $407,000 | $136,000 | $271,000 |
| 2021 | $6,430 | $395,200 | $119,200 | $276,000 |
| 2020 | $5,612 | $353,400 | $119,200 | $234,200 |
| 2019 | $5,050 | $326,200 | $119,200 | $207,000 |
| 2018 | $4,641 | $297,500 | $113,200 | $184,300 |
| 2017 | $4,822 | $305,800 | $109,000 | $196,800 |
| 2016 | $5,254 | $330,000 | $100,000 | $230,000 |
| 2015 | $5,132 | $325,200 | $100,000 | $225,200 |
Map
- 9 Elisha Dr
- 480 Wareham St
- Rear Wareham St
- 441 Wareham St
- 386 Wareham St
- 37 Rocky Gutter St
- 28 Wareham St
- 194 Miller St
- 93 Ashley Ln Unit 93
- 357 Wareham St
- 45 Cinnamon Ridge Cir
- 42 Ridge Dr Unit 42
- 60 Benson St
- 36 Spruce St
- 287 Wareham St
- 295 Cherry St
- Lot 9 Christina Way
- 57 Long Point Rd Unit 205
- 77 Thomas St
- 21 Basking Ridge
- 14 Smith St
- 16 Smith St
- 13 Smith St
- 15 Smith St
- 17 Smith St
- 6 Smith St
- 3 Bishop Ave
- 5 Smith Street(general Use)
- 5 Smith St
- 20 Smith St
- 19 Smith St
- 6 Pebble Brook Dr
- 5 Bishop Ave
- 8 Pebble Brook Dr
- 22 Smith St
- 10 Pebble Brook Dr
- 21 Smith St
- 6 Bishop Ave
- 12 Pebble Brook Dr
- Lot 12 Pebble Brook Dr & 0 Miller St
Ask me questions while you tour the home.