11 Studio Dr Windham, ME 04062
Windham AreaEstimated Value: $437,000 - $539,000
About This Home
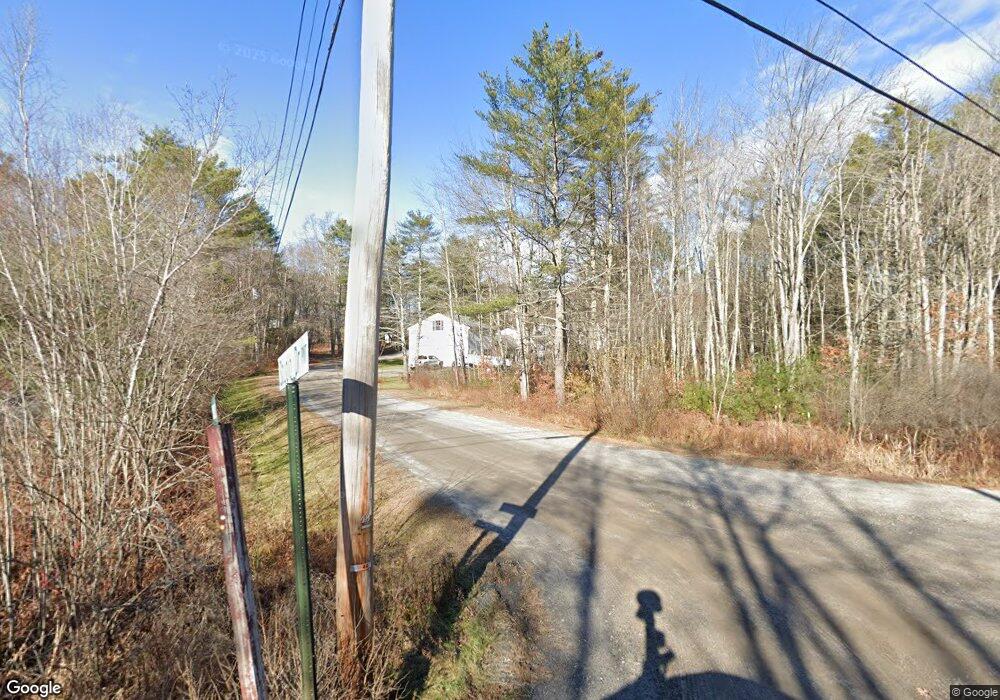
This home is located at 11 Studio Dr, Windham, ME 04062 and is currently estimated at $476,913, approximately $333 per square foot. 11 Studio Dr is a home located in Cumberland County with nearby schools including Windham Primary School, Manchester School, and Windham Middle School.
Ownership History
We collect this data history from publicly available records. To have your information removed, we recommend requesting removal directly through your county’s website.
Purchase Details
Purchase Details
Home Financials for this Owner
Home Financials are based on the most recent Mortgage that was taken out on this home.Home Values in the Area
Average Home Value in this Area
Purchase History
We collect this data history from publicly available records. To have your information removed, we recommend requesting removal directly through your county’s website.
| Date | Buyer | Sale Price | Title Company |
|---|---|---|---|
| -- | -- | ||
| -- | -- |
Mortgage History
We collect this data history from publicly available records. To have your information removed, we recommend requesting removal directly through your county’s website.
| Date | Status | Borrower | Loan Amount |
|---|---|---|---|
| Previous Owner | $5,407 | ||
| Previous Owner | $58,363 | ||
| Previous Owner | $222,803 | ||
| Closed | $30,000 |
Tax History
We collect this data history from publicly available records. To have your information removed, we recommend requesting removal directly through your county’s website.
| Year | Tax Paid | Tax Assessment Tax Assessment Total Assessment is a certain percentage of the fair market value that is determined by local assessors to be the total taxable value of land and additions on the property. | Land | Improvement |
|---|---|---|---|---|
| 2025 | $4,431 | $367,400 | $135,600 | $231,800 |
| 2024 | $4,214 | $367,400 | $135,600 | $231,800 |
| 2023 | $3,895 | $347,800 | $126,200 | $221,600 |
| 2022 | $3,591 | $309,300 | $112,400 | $196,900 |
| 2021 | $3,408 | $270,500 | $97,800 | $172,700 |
| 2020 | $3,525 | $235,000 | $86,100 | $148,900 |
| 2019 | $3,326 | $227,200 | $86,100 | $141,100 |
| 2018 | $3,159 | $208,100 | $77,500 | $130,600 |
| 2017 | $2,971 | $180,800 | $68,900 | $111,900 |
| 2016 | $2,839 | $180,800 | $68,900 | $111,900 |
| 2015 | $2,739 | $180,800 | $68,900 | $111,900 |
| 2014 | $2,506 | $180,800 | $68,900 | $111,900 |
| 2013 | -- | $180,800 | $68,900 | $111,900 |
Map
- 25 Jeffrey Woods Rd
- 278 Falmouth Rd
- 402 Roosevelt Trail
- 7 Mancini Rd
- 41 Lotts Dr
- 26 Dolley Farm Rd Unit 12
- 1 Vista Dr
- 7 Birdsong Ln
- 80 Vista Dr
- 6 Dolley Farm Rd Unit 3
- 0 Hall Rd
- 305 Windham Center Rd
- 243 Windham Center Rd
- 7 Hall Rd
- 8 Dutton Hill Rd
- 12 Turkey Trail Unit 20
- 22 Turkey Trail
- 528 Roosevelt Trail
- 439 Falmouth Rd
- Lot 44 -A
Ask me questions while you tour the home.