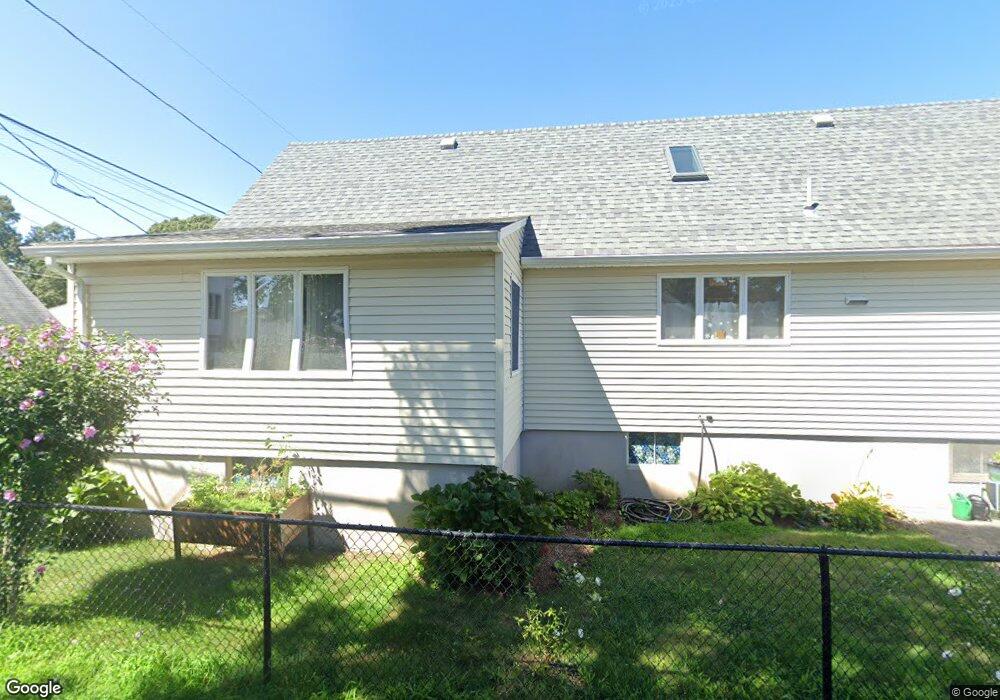
11 Trinity Ln Wareham, MA 02571
Estimated Value: $389,000 - $441,000
3
Beds
2
Baths
1,420
Sq Ft
$293/Sq Ft
Est. Value
About This Home
This home is located at 11 Trinity Ln, Wareham, MA 02571 and is currently estimated at $416,376, approximately $293 per square foot. 11 Trinity Ln is a home.
Ownership History
We collect this data history from publicly available records. To have your information removed, we recommend requesting removal directly through your county’s website.
Date
Name
Owned For
Owner Type
Purchase Details
Closed on
May 18, 2021
Sold by
Bought by
Current Estimated Value
Purchase Details
Closed on
Dec 31, 2020
Sold by
Bought by
Purchase Details
Closed on
Sep 26, 2012
Sold by
Bought by
Create a Home Valuation Report for This Property
The Home Valuation Report is an in-depth analysis detailing your home's value as well as a comparison with similar homes in the area
Home Values in the Area
Average Home Value in this Area
Purchase History
We collect this data history from publicly available records. To have your information removed, we recommend requesting removal directly through your county’s website.
| Date | Buyer | Sale Price | Title Company |
|---|---|---|---|
| -- | None Available | ||
| -- | None Available | ||
| $270,000 | None Available | ||
| $270,000 | None Available | ||
| $270,000 | None Available | ||
| $104,000 | -- | ||
| $104,000 | -- | ||
| $104,000 | -- |
Source: Public Records
Tax History
We collect this data history from publicly available records. To have your information removed, we recommend requesting removal directly through your county’s website.
| Year | Tax Paid | Tax Assessment Tax Assessment Total Assessment is a certain percentage of the fair market value that is determined by local assessors to be the total taxable value of land and additions on the property. | Land | Improvement |
|---|---|---|---|---|
| 2025 | $3,305 | $301,000 | $99,300 | $201,700 |
| 2024 | $3,193 | $273,400 | $74,800 | $198,600 |
| 2023 | $2,961 | $240,700 | $68,000 | $172,700 |
| 2022 | $2,600 | $190,900 | $68,000 | $122,900 |
| 2021 | $2,213 | $158,100 | $68,000 | $90,100 |
| 2020 | $2,168 | $158,100 | $68,000 | $90,100 |
| 2019 | $1,981 | $146,100 | $61,000 | $85,100 |
| 2018 | $1,928 | $137,300 | $61,000 | $76,300 |
| 2017 | $1,879 | $134,400 | $61,000 | $73,400 |
| 2016 | $1,770 | $125,600 | $58,000 | $67,600 |
| 2015 | $1,800 | $131,400 | $58,000 | $73,400 |
| 2014 | $2,128 | $160,100 | $55,100 | $105,000 |
Source: Public Records
Map
Nearby Homes
- 11 Union St Unit B
- 11 Union St
- 21 Union St
- 3 Highland Bay Dr
- 3 Highland Ave
- 12 Cw Bishop Ave
- 7 Union St Unit 2
- 7 Union St Unit B
- 7 Union St
- 10 Cw Bishop Ave
- 8 Cw Bishop Ave
- 219 Onset Ave Unit1
- 219 Onset Ave Unit C1
- 219 Onset Ave
- 219 Onset Ave Unit 2
- 219 Onset Ave
- 6 C W Bishop Ave
- 215 Onset Ave
- 215 Onset Ave Unit 3B
- 215 Onset Ave Unit C3
Your Personal Tour Guide
Ask me questions while you tour the home.