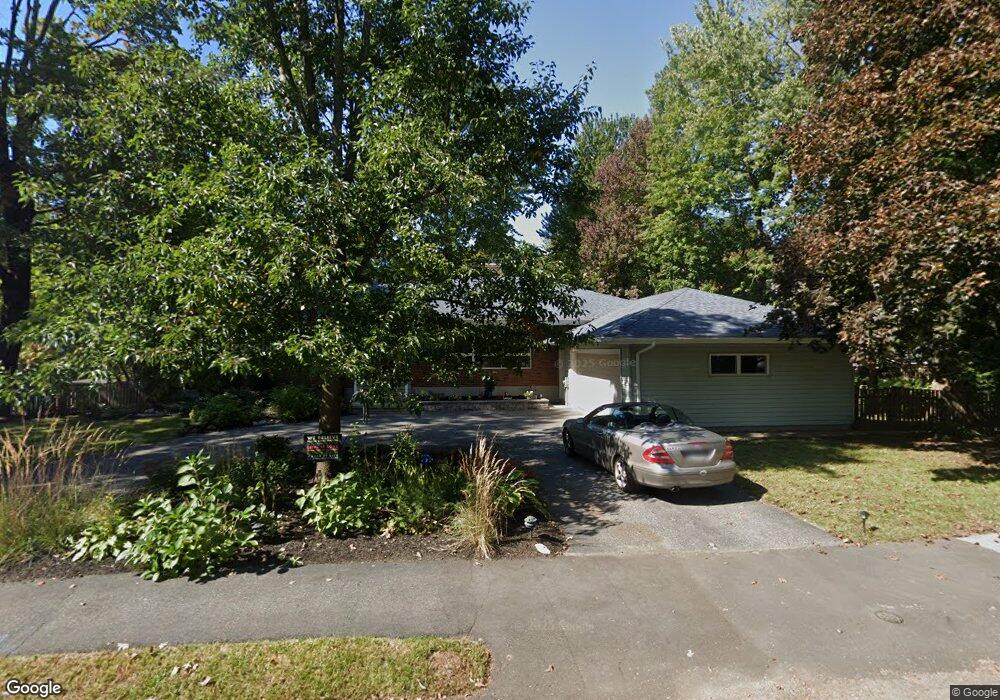
11 Willow St Needham, MA 02492
Estimated Value: $1,294,000 - $1,584,000
3
Beds
3
Baths
1,848
Sq Ft
$786/Sq Ft
Est. Value
About This Home
This home is located at 11 Willow St, Needham, MA 02492 and is currently estimated at $1,451,930, approximately $785 per square foot. 11 Willow St is a home located in Norfolk County with nearby schools including Newman Elementary School, High Rock Middle School, and Pollard Middle School.
Ownership History
Date
Name
Owned For
Owner Type
Purchase Details
Closed on
May 31, 2011
Sold by
Brown Michael S and Brown Jane E
Bought by
Brown Jane E
Current Estimated Value
Purchase Details
Closed on
Jan 18, 1985
Bought by
Brown Jane E
Create a Home Valuation Report for This Property
The Home Valuation Report is an in-depth analysis detailing your home's value as well as a comparison with similar homes in the area
Home Values in the Area
Average Home Value in this Area
Purchase History
We collect this data history from publicly available records. To have your information removed, we recommend requesting removal directly through your county’s website.
| Date | Buyer | Sale Price | Title Company |
|---|---|---|---|
| Brown Jane E | -- | -- | |
| Brown Jane E | -- | -- | |
| Brown Jane E | $185,000 | -- |
Source: Public Records
Mortgage History
We collect this data history from publicly available records. To have your information removed, we recommend requesting removal directly through your county’s website.
| Date | Status | Borrower | Loan Amount |
|---|---|---|---|
| Previous Owner | Brown Jane E | $174,039 | |
| Previous Owner | Brown Jane E | $170,300 | |
| Previous Owner | Brown Jane E | $175,000 | |
| Previous Owner | Brown Jane E | $160,000 |
Source: Public Records
Tax History
| Year | Tax Paid | Tax Assessment Tax Assessment Total Assessment is a certain percentage of the fair market value that is determined by local assessors to be the total taxable value of land and additions on the property. | Land | Improvement |
|---|---|---|---|---|
| 2025 | $11,766 | $1,110,000 | $725,400 | $384,600 |
| 2024 | $10,306 | $823,200 | $529,400 | $293,800 |
| 2023 | $10,441 | $800,700 | $529,400 | $271,300 |
| 2022 | $10,161 | $760,000 | $499,600 | $260,400 |
| 2021 | $9,903 | $760,000 | $499,600 | $260,400 |
| 2020 | $9,515 | $761,800 | $499,600 | $262,200 |
| 2019 | $8,856 | $714,800 | $454,500 | $260,300 |
| 2018 | $8,492 | $714,800 | $454,500 | $260,300 |
| 2017 | $8,082 | $679,700 | $454,500 | $225,200 |
| 2016 | $8,086 | $700,700 | $454,500 | $246,200 |
| 2015 | $7,911 | $700,700 | $454,500 | $246,200 |
| 2014 | $7,601 | $653,000 | $413,500 | $239,500 |
Source: Public Records
Map
Nearby Homes
- 72 Marked Tree Rd
- 105 Blake St
- 5 Colonial Rd
- 1362 Great Plain Ave Unit 1
- 1360 Great Plain Ave
- 22 Barrett St
- 34 Pond St
- 64 Gayland Rd
- 131 Fair Oaks Park
- 620 High Rock St
- 19 Oakland Ave Unit 19
- 19 Oakland Ave
- 52 Hancock Rd
- 277 Rosemary St
- 1069 Central Ave
- 1480 Great Plain Ave
- 238 Harris Ave
- 17 Sunrise Terrace
- 114 Parish Rd
- 100 Rosemary Way Unit 206
Your Personal Tour Guide
Ask me questions while you tour the home.