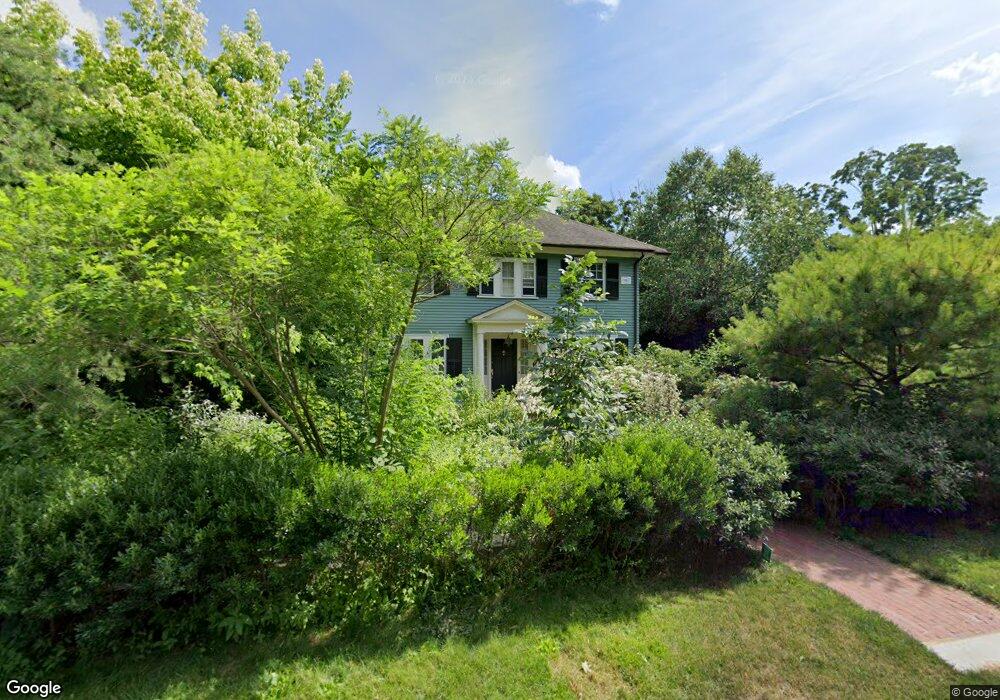
11 Windsor Rd Wellesley Hills, MA 02481
Estimated Value: $1,674,311 - $2,850,000
4
Beds
3
Baths
2,119
Sq Ft
$1,047/Sq Ft
Est. Value
About This Home
This home is located at 11 Windsor Rd, Wellesley Hills, MA 02481 and is currently estimated at $2,219,328, approximately $1,047 per square foot. 11 Windsor Rd is a home located in Norfolk County with nearby schools including Joseph E. Fiske Elementary School, Wellesley Middle School, and Wellesley Sr High School.
Ownership History
Date
Name
Owned For
Owner Type
Purchase Details
Closed on
Aug 21, 2008
Sold by
Place H Calvin and Place Nancy H
Bought by
11 Windsor Road Nt and Fulham Timothy W
Current Estimated Value
Purchase Details
Closed on
Jun 15, 1999
Sold by
Hazard Charles M and Hazard Donna L
Bought by
Place H Calvin and Place Nancy H
Home Financials for this Owner
Home Financials are based on the most recent Mortgage that was taken out on this home.
Original Mortgage
$350,000
Interest Rate
6.9%
Mortgage Type
Purchase Money Mortgage
Purchase Details
Closed on
Aug 15, 1994
Sold by
Whitney William L and Whitney William J
Bought by
Hazard Charles M and Hazard Donna K
Home Financials for this Owner
Home Financials are based on the most recent Mortgage that was taken out on this home.
Original Mortgage
$440,000
Interest Rate
8.52%
Mortgage Type
Purchase Money Mortgage
Create a Home Valuation Report for This Property
The Home Valuation Report is an in-depth analysis detailing your home's value as well as a comparison with similar homes in the area
Purchase History
| Date | Buyer | Sale Price | Title Company |
|---|---|---|---|
| 11 Windsor Road Nt | $1,225,000 | -- | |
| Place H Calvin | $680,000 | -- | |
| Hazard Charles M | $550,000 | -- |
Source: Public Records
Mortgage History
| Date | Status | Borrower | Loan Amount |
|---|---|---|---|
| Previous Owner | Hazard Charles M | $350,000 | |
| Previous Owner | Hazard Charles M | $440,000 | |
| Previous Owner | Hazard Charles M | $190,000 |
Source: Public Records
Tax History
| Year | Tax Paid | Tax Assessment Tax Assessment Total Assessment is a certain percentage of the fair market value that is determined by local assessors to be the total taxable value of land and additions on the property. | Land | Improvement |
|---|---|---|---|---|
| 2025 | $15,235 | $1,482,000 | $1,069,000 | $413,000 |
| 2024 | $15,282 | $1,468,000 | $1,069,000 | $399,000 |
| 2023 | $15,091 | $1,318,000 | $954,000 | $364,000 |
| 2022 | $14,226 | $1,218,000 | $855,000 | $363,000 |
| 2021 | $13,618 | $1,159,000 | $796,000 | $363,000 |
| 2020 | $13,398 | $1,159,000 | $796,000 | $363,000 |
| 2019 | $13,629 | $1,178,000 | $825,000 | $353,000 |
| 2018 | $13,300 | $1,113,000 | $814,000 | $299,000 |
| 2017 | $13,028 | $1,105,000 | $815,000 | $290,000 |
| 2016 | $12,682 | $1,072,000 | $801,000 | $271,000 |
| 2015 | $12,369 | $1,070,000 | $797,000 | $273,000 |
Source: Public Records
Map
Nearby Homes
Your Personal Tour Guide
Ask me questions while you tour the home.