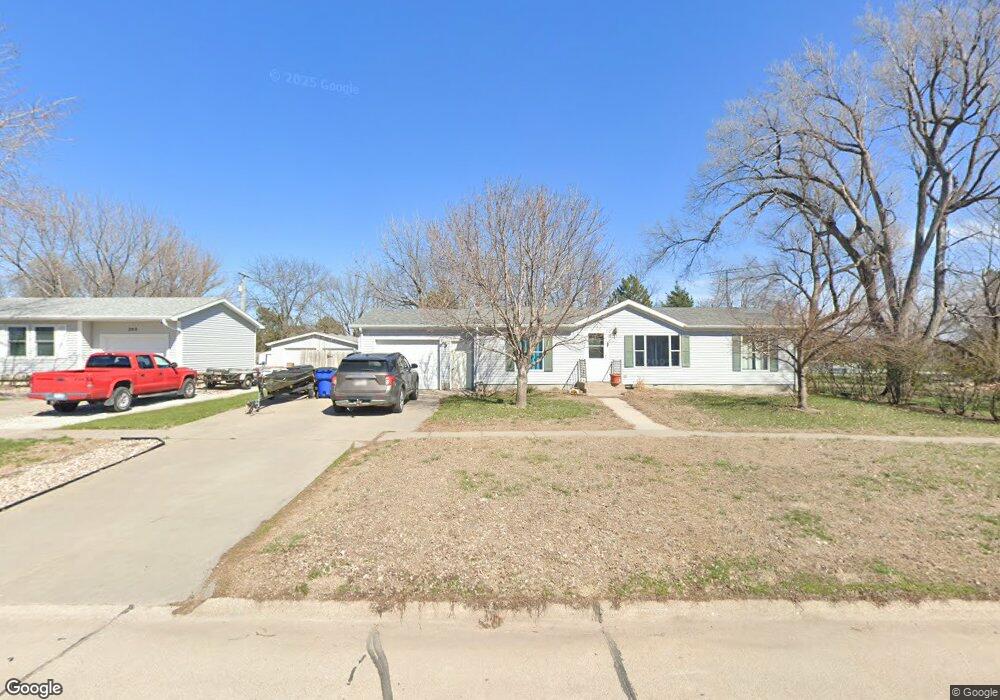
110 9th St Aurora, NE 68818
Estimated Value: $162,000 - $192,000
Studio
2
Baths
1,188
Sq Ft
$148/Sq Ft
Est. Value
About This Home
This home is located at 110 9th St, Aurora, NE 68818 and is currently estimated at $175,320, approximately $147 per square foot. 110 9th St is a home located in Hamilton County with nearby schools including Aurora Elementary School, Aurora Middle School, and Aurora High School.
Ownership History
Date
Name
Owned For
Owner Type
Purchase Details
Closed on
Apr 3, 2017
Sold by
Bergen Timothy D and Bergen Roberta L
Bought by
Central Nebraska Properties Llc
Current Estimated Value
Home Financials for this Owner
Home Financials are based on the most recent Mortgage that was taken out on this home.
Original Mortgage
$60,000
Outstanding Balance
$49,572
Interest Rate
4.21%
Mortgage Type
New Conventional
Estimated Equity
$125,748
Purchase Details
Closed on
Oct 8, 2010
Sold by
Braun Karen
Bought by
Bergen Timothy D and Bergen Roberta L
Create a Home Valuation Report for This Property
The Home Valuation Report is an in-depth analysis detailing your home's value as well as a comparison with similar homes in the area
Home Values in the Area
Average Home Value in this Area
Purchase History
| Date | Buyer | Sale Price | Title Company |
|---|---|---|---|
| Central Nebraska Properties Llc | $80,000 | None Available | |
| Bergen Timothy D | $65,000 | -- |
Source: Public Records
Mortgage History
| Date | Status | Borrower | Loan Amount |
|---|---|---|---|
| Open | Central Nebraska Properties Llc | $60,000 |
Source: Public Records
Tax History
| Year | Tax Paid | Tax Assessment Tax Assessment Total Assessment is a certain percentage of the fair market value that is determined by local assessors to be the total taxable value of land and additions on the property. | Land | Improvement |
|---|---|---|---|---|
| 2025 | $1,456 | $137,085 | $20,495 | $116,590 |
| 2024 | $1,427 | $131,845 | $20,495 | $111,350 |
| 2023 | $1,731 | $122,650 | $20,495 | $102,155 |
| 2022 | $1,835 | $122,650 | $20,495 | $102,155 |
| 2021 | $1,483 | $97,510 | $20,495 | $77,015 |
| 2020 | $1,445 | $97,510 | $20,495 | $77,015 |
| 2019 | $1,352 | $91,805 | $20,495 | $71,310 |
| 2018 | $1,148 | $81,565 | $20,495 | $61,070 |
| 2017 | $976 | $69,270 | $8,200 | $61,070 |
| 2016 | $948 | $69,700 | $8,630 | $61,070 |
| 2010 | $1,321 | $69,700 | $0 | $0 |
Source: Public Records
Map
Nearby Homes
Your Personal Tour Guide
Ask me questions while you tour the home.