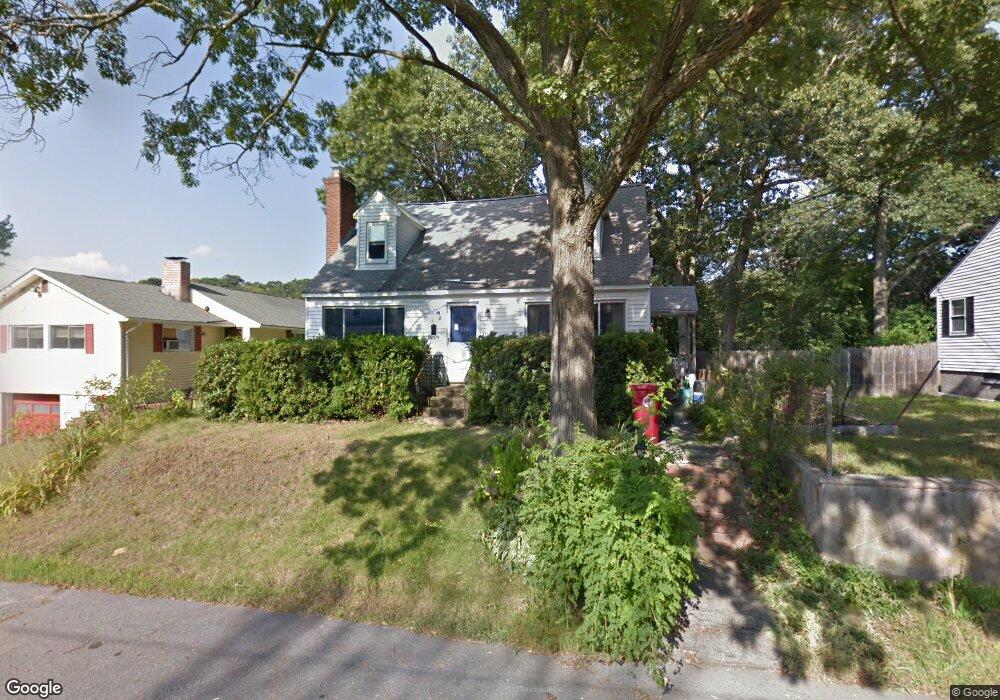
110 Belrose Ave Lowell, MA 01852
Belvidere NeighborhoodEstimated Value: $507,718 - $592,000
3
Beds
2
Baths
1,975
Sq Ft
$282/Sq Ft
Est. Value
About This Home
This home is located at 110 Belrose Ave, Lowell, MA 01852 and is currently estimated at $556,680, approximately $281 per square foot. 110 Belrose Ave is a home located in Middlesex County with nearby schools including Moody Elementary School, Abraham Lincoln Elementary School, and Greenhalge Elementary School.
Ownership History
Date
Name
Owned For
Owner Type
Purchase Details
Closed on
May 31, 1996
Sold by
Mccarthy Viola
Bought by
Hebert Sandra
Current Estimated Value
Home Financials for this Owner
Home Financials are based on the most recent Mortgage that was taken out on this home.
Original Mortgage
$108,750
Outstanding Balance
$6,891
Interest Rate
7.91%
Mortgage Type
Purchase Money Mortgage
Estimated Equity
$549,789
Create a Home Valuation Report for This Property
The Home Valuation Report is an in-depth analysis detailing your home's value as well as a comparison with similar homes in the area
Home Values in the Area
Average Home Value in this Area
Purchase History
| Date | Buyer | Sale Price | Title Company |
|---|---|---|---|
| Hebert Sandra | $114,900 | -- | |
| Hebert Sandra | $114,900 | -- |
Source: Public Records
Mortgage History
| Date | Status | Borrower | Loan Amount |
|---|---|---|---|
| Open | Hebert Sandra | $34,000 | |
| Open | Hebert Sandra | $108,750 | |
| Closed | Hebert Sandra | $108,750 | |
| Previous Owner | Hebert Sandra | $35,000 | |
| Closed | Hebert Sandra | $2,872 |
Source: Public Records
Tax History
| Year | Tax Paid | Tax Assessment Tax Assessment Total Assessment is a certain percentage of the fair market value that is determined by local assessors to be the total taxable value of land and additions on the property. | Land | Improvement |
|---|---|---|---|---|
| 2025 | $5,050 | $439,900 | $136,700 | $303,200 |
| 2024 | $4,936 | $414,400 | $139,500 | $274,900 |
| 2023 | $4,797 | $386,200 | $116,800 | $269,400 |
| 2022 | $4,410 | $347,500 | $106,200 | $241,300 |
| 2021 | $4,296 | $319,200 | $92,300 | $226,900 |
| 2020 | $4,227 | $316,400 | $92,300 | $224,100 |
| 2019 | $4,062 | $289,300 | $80,500 | $208,800 |
| 2018 | $3,916 | $272,100 | $76,700 | $195,400 |
| 2017 | $3,812 | $255,500 | $73,300 | $182,200 |
| 2016 | $3,472 | $229,000 | $63,000 | $166,000 |
| 2015 | $3,454 | $223,100 | $63,000 | $160,100 |
| 2013 | $3,256 | $216,900 | $76,000 | $140,900 |
Source: Public Records
Map
Nearby Homes
- 317 Nesmith St
- 200 Rogers St Unit 6
- 44 Hanks St
- 169 Starr Ave
- 234 Nesmith St Unit 8
- 810 Lawrence St Unit C
- 21 Agawam St
- 5 Lenox St Unit 4
- 31 Merrill St
- 471 Butman Rd
- 36 Crowley St
- 158 Concord St
- 88 Perry St
- 43 Wamesit St
- 58 Brunswick St
- 28 Warnock St
- 1204 Lawrence St
- 14 Warnock St
- 708 Central St
- 37 Stavely St
Your Personal Tour Guide
Ask me questions while you tour the home.