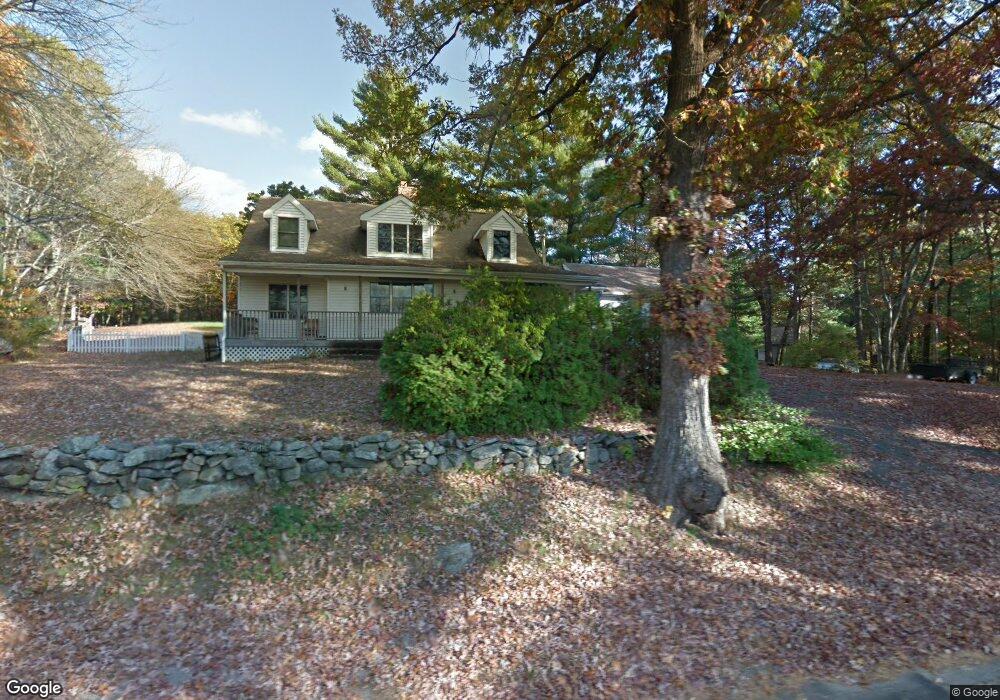
110 Cooper Rd Northbridge, MA 01534
Estimated Value: $482,000 - $577,000
2
Beds
1
Bath
1,080
Sq Ft
$497/Sq Ft
Est. Value
About This Home
This home is located at 110 Cooper Rd, Northbridge, MA 01534 and is currently estimated at $536,954, approximately $497 per square foot. 110 Cooper Rd is a home located in Worcester County with nearby schools including Northbridge Elementary School, Northbridge Middle School, and Northbridge High School.
Ownership History
Date
Name
Owned For
Owner Type
Purchase Details
Closed on
Feb 14, 1997
Sold by
Baird Helen W
Bought by
Lapierre John J and Lapierre Donna L
Current Estimated Value
Home Financials for this Owner
Home Financials are based on the most recent Mortgage that was taken out on this home.
Original Mortgage
$100,000
Interest Rate
7.6%
Mortgage Type
Purchase Money Mortgage
Create a Home Valuation Report for This Property
The Home Valuation Report is an in-depth analysis detailing your home's value as well as a comparison with similar homes in the area
Home Values in the Area
Average Home Value in this Area
Purchase History
| Date | Buyer | Sale Price | Title Company |
|---|---|---|---|
| Lapierre John J | $100,000 | -- | |
| Lapierre John J | $100,000 | -- |
Source: Public Records
Mortgage History
| Date | Status | Borrower | Loan Amount |
|---|---|---|---|
| Open | Lapierre John J | $217,900 | |
| Closed | Lapierre John J | $234,000 | |
| Closed | Lapierre John J | $40,000 | |
| Closed | Lapierre John J | $100,000 |
Source: Public Records
Tax History
| Year | Tax Paid | Tax Assessment Tax Assessment Total Assessment is a certain percentage of the fair market value that is determined by local assessors to be the total taxable value of land and additions on the property. | Land | Improvement |
|---|---|---|---|---|
| 2025 | $6,013 | $510,000 | $162,200 | $347,800 |
| 2024 | $5,818 | $481,200 | $162,200 | $319,000 |
| 2023 | $5,833 | $450,100 | $162,200 | $287,900 |
| 2022 | $5,351 | $388,600 | $126,200 | $262,400 |
| 2021 | $5,198 | $358,700 | $120,300 | $238,400 |
| 2020 | $4,825 | $348,600 | $120,300 | $228,300 |
| 2019 | $4,325 | $333,500 | $120,300 | $213,200 |
| 2018 | $3,416 | $317,900 | $114,700 | $203,200 |
| 2017 | $2,555 | $302,900 | $114,700 | $188,200 |
| 2016 | $3,889 | $282,800 | $104,500 | $178,300 |
| 2015 | $3,795 | $283,600 | $104,500 | $179,100 |
| 2014 | $3,761 | $283,600 | $104,500 | $179,100 |
Source: Public Records
Map
Nearby Homes
- 659 Highland St
- 90 Windstone Dr
- 155 Kelly Rd
- 130 Sheryl Dr
- 97 Marion Dr
- 2120 Providence Rd
- 9 Central Ave Unit 11
- 2248 Providence Rd
- 2294 Providence Rd
- 377 Rumonoski Dr
- 2428-2430 Providence Rd
- 0 Emond St Unit 1
- 0 Emond St Unit 73480228
- 320 Lincoln Cir
- 1825 Quaker St
- 656 Shining Rock Dr
- 18 Delray Gardens
- 268 Pollard Rd
- 608 Church St
- 61 Hillview Ln
Your Personal Tour Guide
Ask me questions while you tour the home.