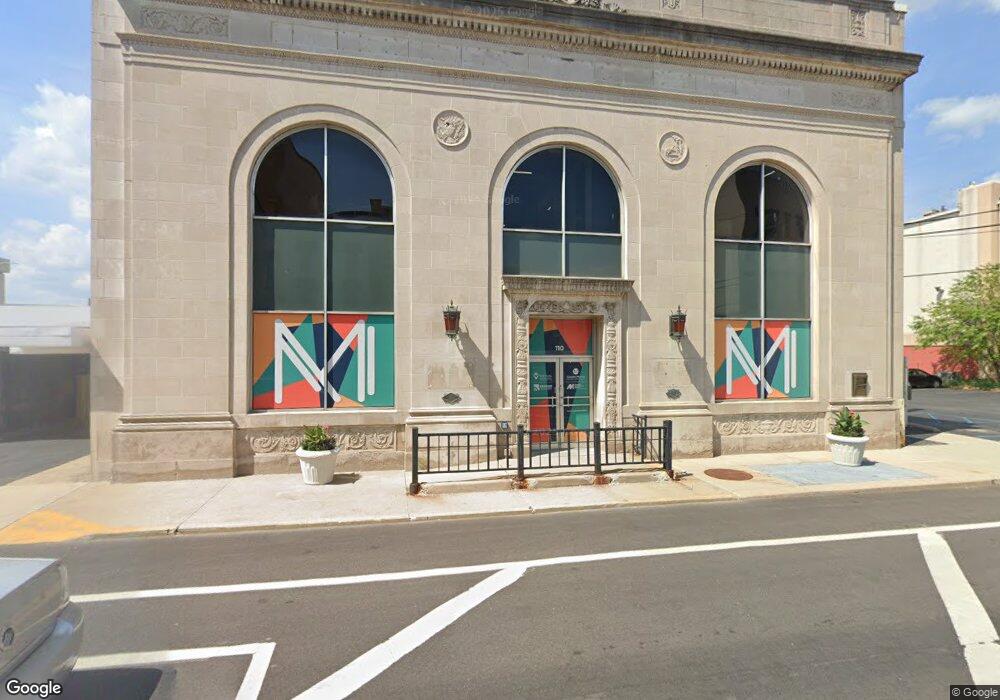
110 E Main St Muncie, IN 47305
Downtown Muncie NeighborhoodEstimated Value: $89,000 - $145,883
About This Home
This home is located at 110 E Main St, Muncie, IN 47305 and is currently estimated at $126,628, approximately $81 per square foot. 110 E Main St is a home located in Delaware County with nearby schools including Muncie Central High School, East Washington Academy, and Northside Middle School.
Ownership History
We collect this data history from publicly available records. To have your information removed, we recommend requesting removal directly through your county’s website.
Purchase Details
Home Financials for this Owner
Home Financials are based on the most recent Mortgage that was taken out on this home.Home Values in the Area
Average Home Value in this Area
Purchase History
We collect this data history from publicly available records. To have your information removed, we recommend requesting removal directly through your county’s website.
| Date | Buyer | Sale Price | Title Company |
|---|---|---|---|
| -- | None Available |
Mortgage History
We collect this data history from publicly available records. To have your information removed, we recommend requesting removal directly through your county’s website.
| Date | Status | Borrower | Loan Amount |
|---|---|---|---|
| Open | $205,000 | ||
| Open | $300,000 | ||
| Closed | $135,000 |
Tax History
We collect this data history from publicly available records. To have your information removed, we recommend requesting removal directly through your county’s website.
| Year | Tax Paid | Tax Assessment Tax Assessment Total Assessment is a certain percentage of the fair market value that is determined by local assessors to be the total taxable value of land and additions on the property. | Land | Improvement |
|---|---|---|---|---|
| 2025 | $2,051 | $101,500 | $14,200 | $87,300 |
| 2024 | $1,681 | $83,000 | $14,200 | $68,800 |
| 2023 | $1,681 | $83,000 | $14,200 | $68,800 |
| 2022 | $935 | $45,700 | $14,200 | $31,500 |
| 2021 | $857 | $41,800 | $12,800 | $29,000 |
| 2020 | $857 | $41,800 | $12,800 | $29,000 |
| 2019 | $857 | $69,600 | $12,800 | $56,800 |
| 2018 | $857 | $41,800 | $12,800 | $29,000 |
| 2017 | $907 | $44,300 | $12,800 | $31,500 |
| 2016 | $464 | $75,500 | $12,800 | $62,700 |
| 2014 | $1,418 | $70,400 | $12,800 | $57,600 |
| 2013 | -- | $69,800 | $12,800 | $57,000 |
Map
- 212 N Elm St
- 416 N Mulberry St
- 406 N Alameda Dr
- 314 N Monroe St
- 220 S Gharkey St
- 708 W Jackson St
- 222 N Vine St
- 719 E Washington St
- 610 S Council St
- 409 N Pershing Dr
- 712 N Walnut St
- 714 N Walnut St
- 716 N Walnut St
- 718 N Walnut St
- 619 W Ashland Ave
- 907 W Main St
- 430 S Proud St
- 740 N Jefferson St
- 1007 E Main St
- 810 N Walnut St
- 108 S Walnut St
- 105 E Main St
- 108 S Walnut St Unit 206/207
- 4501-2-303 N Wheeling Ave
- 4501-7A-205 N Wheeling Ave
- 4501-7A-205 N Wheeling Ave Unit 7A-205
- 1721 S Stoneybrook Lot 19 Drives
- 109 E Main St
- 113 E Main St
- 109, 107, & 113 E Main St
- 110 E Main St
- 120 S Walnut St
- 117 E Main St
- 116 S Walnut St
- 122 S Walnut St
- 115 S Walnut St
- 124 E Main St
- 124 N Walnut St
- 105 E Jackson St
- 200 S Walnut 200 - Unit 2C
Ask me questions while you tour the home.