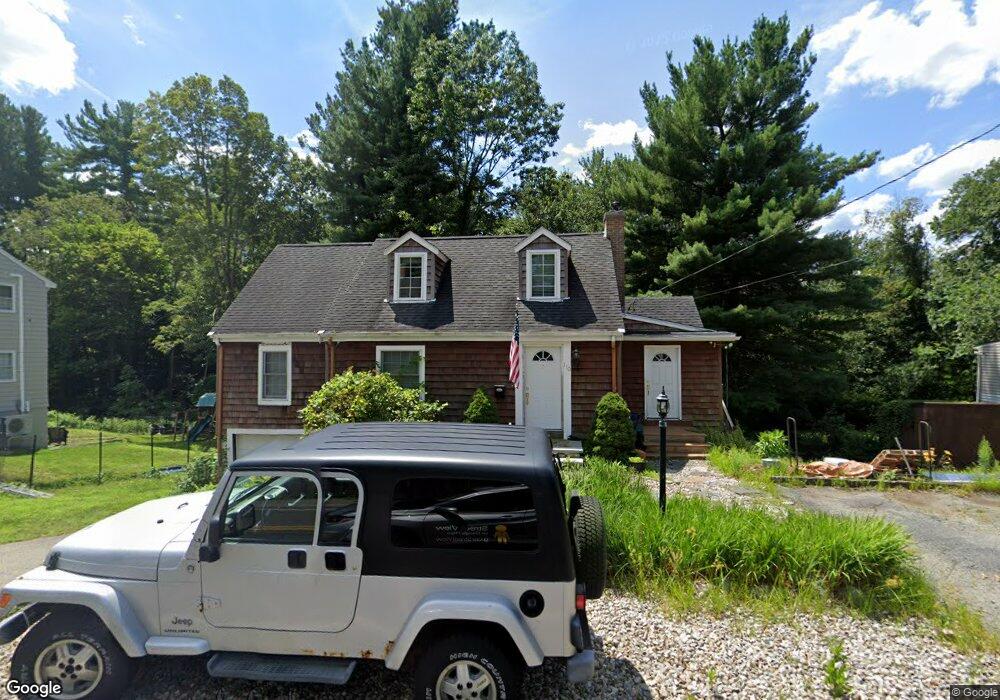
110 Grove St Reading, MA 01867
Estimated Value: $757,000 - $883,000
3
Beds
2
Baths
1,450
Sq Ft
$577/Sq Ft
Est. Value
About This Home
This home is located at 110 Grove St, Reading, MA 01867 and is currently estimated at $836,367, approximately $576 per square foot. 110 Grove St is a home located in Middlesex County with nearby schools including Birch Meadow Elementary School, Arthur W. Coolidge Middle School, and Reading Memorial High School.
Ownership History
Date
Name
Owned For
Owner Type
Purchase Details
Closed on
Aug 30, 2005
Sold by
Smith Barbara C
Bought by
Van-Magness Bradford and Van-Magness Tracey A
Current Estimated Value
Home Financials for this Owner
Home Financials are based on the most recent Mortgage that was taken out on this home.
Original Mortgage
$170,000
Outstanding Balance
$86,585
Interest Rate
5.68%
Mortgage Type
Purchase Money Mortgage
Estimated Equity
$749,782
Create a Home Valuation Report for This Property
The Home Valuation Report is an in-depth analysis detailing your home's value as well as a comparison with similar homes in the area
Home Values in the Area
Average Home Value in this Area
Purchase History
We collect this data history from publicly available records. To have your information removed, we recommend requesting removal directly through your county’s website.
| Date | Buyer | Sale Price | Title Company |
|---|---|---|---|
| Van-Magness Bradford | $365,000 | -- |
Source: Public Records
Mortgage History
We collect this data history from publicly available records. To have your information removed, we recommend requesting removal directly through your county’s website.
| Date | Status | Borrower | Loan Amount |
|---|---|---|---|
| Open | Van-Magness Bradford | $170,000 |
Source: Public Records
Tax History
| Year | Tax Paid | Tax Assessment Tax Assessment Total Assessment is a certain percentage of the fair market value that is determined by local assessors to be the total taxable value of land and additions on the property. | Land | Improvement |
|---|---|---|---|---|
| 2025 | $8,514 | $747,500 | $429,700 | $317,800 |
| 2024 | $8,496 | $724,900 | $416,700 | $308,200 |
| 2023 | $7,951 | $631,500 | $363,000 | $268,500 |
| 2022 | $7,550 | $566,400 | $325,600 | $240,800 |
| 2021 | $7,305 | $529,000 | $312,500 | $216,500 |
| 2020 | $7,233 | $518,500 | $306,300 | $212,200 |
| 2019 | $7,025 | $493,700 | $291,700 | $202,000 |
| 2018 | $6,628 | $461,100 | $272,400 | $188,700 |
| 2017 | $6,184 | $440,800 | $260,400 | $180,400 |
| 2016 | $5,951 | $410,400 | $247,900 | $162,500 |
| 2015 | $5,576 | $379,300 | $229,100 | $150,200 |
| 2014 | $5,402 | $366,500 | $221,400 | $145,100 |
Source: Public Records
Map
Nearby Homes
- 106 Grove St
- 32 Criterion Rd
- 480 West St
- 85 Mineral St
- 44 Grandview Rd
- 35 Blueberry Ln
- 120 Summer Ave
- 17 Courtyard Place Unit 17
- 7 King St
- 55 Blueberry Ln
- 856 Main St
- 127 Johnson Woods Dr
- 2 Inwood Dr Unit 3012
- 10 Deer Path Ln Unit 10
- 168 Summer Ave
- 106 Johnson Woods Dr Unit 106
- 22 Irving St
- 16 Taylor Dr Unit 3012
- 16 Taylor Dr Unit 3003
- 394 Pearl St
Your Personal Tour Guide
Ask me questions while you tour the home.