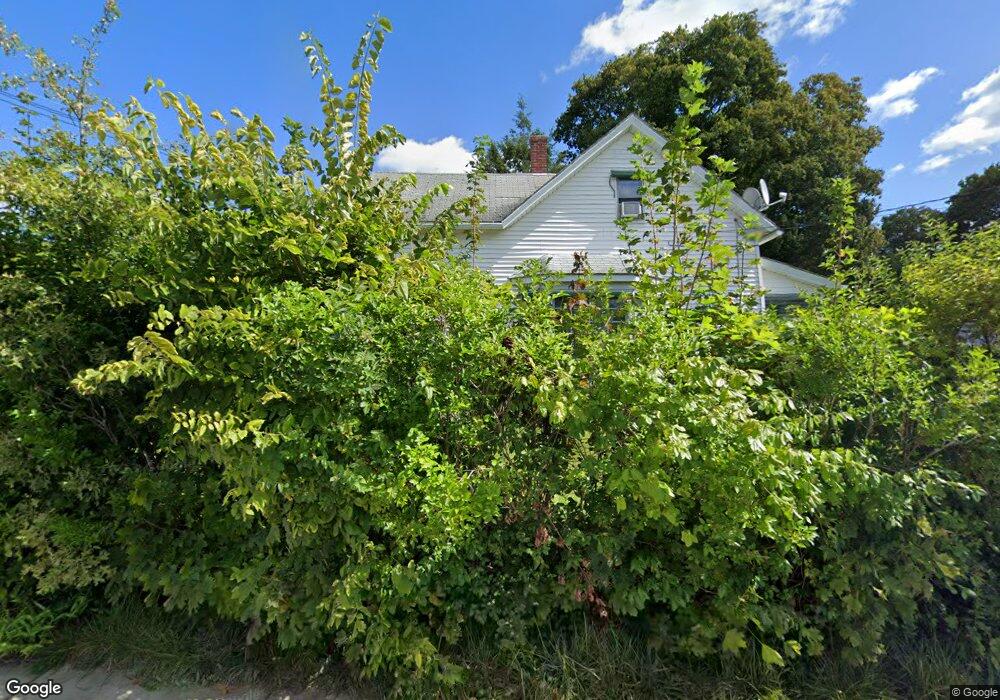
110 Mechanic St Danielson, CT 06239
Estimated Value: $236,000 - $277,000
3
Beds
1
Bath
948
Sq Ft
$267/Sq Ft
Est. Value
About This Home
This home is located at 110 Mechanic St, Danielson, CT 06239 and is currently estimated at $253,151, approximately $267 per square foot. 110 Mechanic St is a home located in Windham County with nearby schools including Killingly Central School, Killingly Memorial School, and Killingly Intermediate School.
Ownership History
Date
Name
Owned For
Owner Type
Purchase Details
Closed on
May 29, 1996
Sold by
Sears Della Est
Bought by
King David C and King Belinda
Current Estimated Value
Home Financials for this Owner
Home Financials are based on the most recent Mortgage that was taken out on this home.
Original Mortgage
$65,900
Interest Rate
7.91%
Mortgage Type
Unknown
Create a Home Valuation Report for This Property
The Home Valuation Report is an in-depth analysis detailing your home's value as well as a comparison with similar homes in the area
Home Values in the Area
Average Home Value in this Area
Purchase History
| Date | Buyer | Sale Price | Title Company |
|---|---|---|---|
| King David C | $66,000 | -- | |
| King David C | $66,000 | -- |
Source: Public Records
Mortgage History
| Date | Status | Borrower | Loan Amount |
|---|---|---|---|
| Open | King David C | $96,400 | |
| Closed | King David C | $65,900 | |
| Previous Owner | King David C | $66,000 | |
| Closed | King David C | $4,300 |
Source: Public Records
Tax History
| Year | Tax Paid | Tax Assessment Tax Assessment Total Assessment is a certain percentage of the fair market value that is determined by local assessors to be the total taxable value of land and additions on the property. | Land | Improvement |
|---|---|---|---|---|
| 2025 | $3,019 | $120,530 | $28,390 | $92,140 |
| 2024 | $2,882 | $120,530 | $28,390 | $92,140 |
| 2023 | $2,181 | $67,970 | $23,450 | $44,520 |
| 2022 | $2,052 | $67,970 | $23,450 | $44,520 |
| 2021 | $2,052 | $67,970 | $23,450 | $44,520 |
| 2020 | $2,018 | $67,970 | $23,450 | $44,520 |
| 2019 | $2,040 | $67,970 | $23,450 | $44,520 |
| 2017 | $1,687 | $52,290 | $14,980 | $37,310 |
| 2016 | $1,687 | $52,290 | $14,980 | $37,310 |
| 2015 | $1,653 | $52,290 | $14,980 | $37,310 |
| 2014 | $1,614 | $52,290 | $14,980 | $37,310 |
Source: Public Records
Map
Nearby Homes
- 23 Winter St
- 74 Athol St
- 10 Center St
- 24 Center St
- 144 Prospect Ave
- 48 Athol St Unit 48
- 18 Palmer St
- 11 Athol St
- 133 Maple St
- 85 Furnace St
- 106 Water St
- 37 Katherine Ave
- 29 Rosedale St
- 43 Woodward St
- 7 Bonneville St
- 124 S Main St
- 20 Wauregan Rd
- 35 S Main St
- 0 Providence Rd Unit 24080985
- 53 S Main St
Your Personal Tour Guide
Ask me questions while you tour the home.