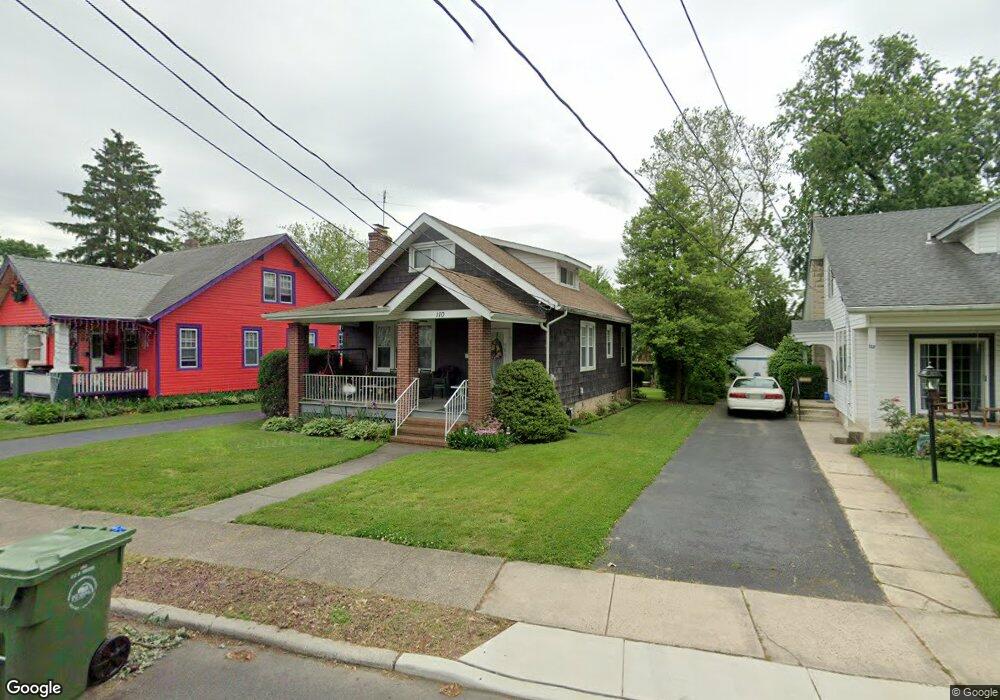
110 Pear St Palmyra, NJ 08065
Estimated Value: $253,224 - $336,000
About This Home
This home is located at 110 Pear St, Palmyra, NJ 08065 and is currently estimated at $306,056, approximately $311 per square foot. 110 Pear St is a home located in Burlington County with nearby schools including Charles Street School, Palmyra Middle School, and Palmyra High School.
Ownership History
We collect this data history from publicly available records. To have your information removed, we recommend requesting removal directly through your county’s website.
Purchase Details
Home Financials for this Owner
Home Financials are based on the most recent Mortgage that was taken out on this home.Home Values in the Area
Average Home Value in this Area
Purchase History
We collect this data history from publicly available records. To have your information removed, we recommend requesting removal directly through your county’s website.
| Date | Buyer | Sale Price | Title Company |
|---|---|---|---|
| $104,000 | -- |
Mortgage History
We collect this data history from publicly available records. To have your information removed, we recommend requesting removal directly through your county’s website.
| Date | Status | Borrower | Loan Amount |
|---|---|---|---|
| Open | $93,600 |
Tax History
We collect this data history from publicly available records. To have your information removed, we recommend requesting removal directly through your county’s website.
| Year | Tax Paid | Tax Assessment Tax Assessment Total Assessment is a certain percentage of the fair market value that is determined by local assessors to be the total taxable value of land and additions on the property. | Land | Improvement |
|---|---|---|---|---|
| 2025 | $6,980 | $152,100 | $58,400 | $93,700 |
| 2024 | $6,440 | $152,100 | $58,400 | $93,700 |
| 2023 | $6,440 | $152,100 | $58,400 | $93,700 |
| 2022 | $6,288 | $152,100 | $58,400 | $93,700 |
| 2021 | $5,661 | $152,100 | $58,400 | $93,700 |
| 2020 | $6,092 | $152,100 | $58,400 | $93,700 |
| 2019 | $5,900 | $152,100 | $58,400 | $93,700 |
| 2018 | $5,816 | $152,100 | $58,400 | $93,700 |
| 2017 | $5,742 | $152,100 | $58,400 | $93,700 |
| 2016 | $5,629 | $152,100 | $58,400 | $93,700 |
| 2015 | $5,549 | $152,100 | $58,400 | $93,700 |
| 2014 | $5,304 | $152,100 | $58,400 | $93,700 |
Map
- 711 Filbert St
- 803 Cinnaminson Ave
- 302 W Henry St
- 108 W Henry St
- 39 Lejune Rd
- 511 Delaware Ave
- 168 Fairfax Dr
- 120 Lejune Rd
- 137 Fairfax Dr
- 823 Columbia Ave
- 511 W 6th St
- 725 Morgan Ave
- 619 Morgan Ave
- 523 W 5th St
- 502 Cinnaminson Ave
- 1403 Glenview Dr
- 1009 Columbia Ave
- 505 Orchard Ave
- 103 Purnell Ave
- 817 Washington Ave
Ask me questions while you tour the home.