Estimated Value: $126,000 - $240,000
2
Beds
2
Baths
2,183
Sq Ft
$85/Sq Ft
Est. Value
About This Home
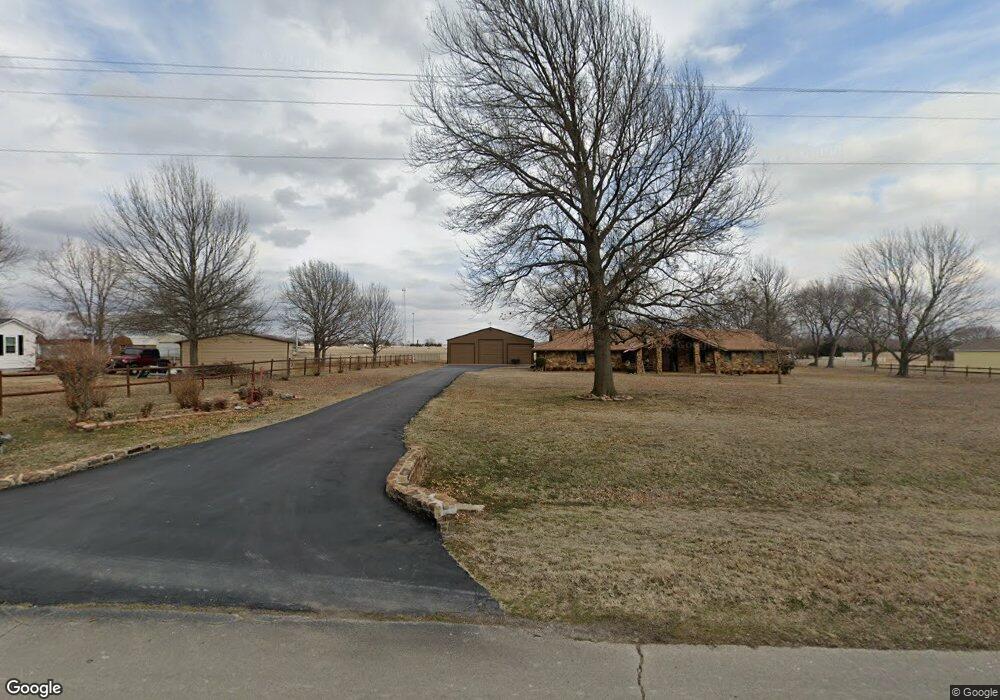
This home is located at 1100 N Caney St, Copan, OK 74022 and is currently estimated at $186,326, approximately $85 per square foot. 1100 N Caney St is a home located in Washington County with nearby schools including Copan Elementary School and Copan High School.
Ownership History
Date
Name
Owned For
Owner Type
Purchase Details
Closed on
Feb 20, 2015
Sold by
Warden Carol J
Bought by
Foster Nicholas E and Foster Amy E
Current Estimated Value
Purchase Details
Closed on
Jan 22, 2004
Sold by
Warden Bob J and Warden Carol J
Create a Home Valuation Report for This Property
The Home Valuation Report is an in-depth analysis detailing your home's value as well as a comparison with similar homes in the area
Purchase History
| Date | Buyer | Sale Price | Title Company |
|---|---|---|---|
| Foster Nicholas E | -- | None Available | |
| -- | -- | -- |
Source: Public Records
Tax History
| Year | Tax Paid | Tax Assessment Tax Assessment Total Assessment is a certain percentage of the fair market value that is determined by local assessors to be the total taxable value of land and additions on the property. | Land | Improvement |
|---|---|---|---|---|
| 2025 | -- | $21,366 | $2,574 | $18,792 |
| 2024 | -- | $6,381 | $2,574 | $3,807 |
| 2023 | $0 | $6,381 | $2,574 | $3,807 |
| 2022 | $0 | $18,147 | $909 | $17,238 |
| 2021 | $0 | $17,105 | $499 | $16,606 |
| 2020 | $0 | $17,105 | $499 | $16,606 |
| 2019 | $0 | $17,105 | $499 | $16,606 |
| 2018 | $0 | $17,105 | $499 | $16,606 |
| 2017 | $0 | $17,105 | $499 | $16,606 |
| 2016 | -- | $16,853 | $499 | $16,354 |
| 2015 | -- | $16,853 | $499 | $16,354 |
| 2014 | -- | $16,853 | $499 | $16,354 |
Source: Public Records
Map
Nearby Homes
- 414 E Golden Ave
- 300 W Weldon Ave
- 400 S Caney St
- 420 S Caney St
- N 3975th Rd
- 401341 Oklahoma 10
- 000 W 1000 Rd
- 0000 W 1000 Rd
- 13908 N 3973 Dr
- 402575 W 700 Rd
- 5 N 3990 Rd
- 6 N 3990 Rd
- 8 N 3990 Rd
- 2 N 3990 Rd
- 398515 W 300 Rd
- 396950 W 1300 Rd
- 13699 N 3980 Rd
- 13790 N 3980 Rd
- 2130 N Osage Ave
- 100 Cherokee St
- 1120 N Caney St
- 1021 N Caney St
- 1024 N Caney St
- 1130 N Caney St
- 1109 N Caney St
- 1025 N Caney St
- 1131 N Caney St
- 1000 N Caney St
- 1105 N Caney St
- 1013 N Caney St
- 0 Summit Dr
- 1210 N Caney St
- 350 E Summit St
- 301 Summit Dr
- 301 E Summit St
- 1200 N Caney St
- 1055 N Caney St
- 900 N Caney St
- 1220 N Caney St
- 1053 N Caney St
Your Personal Tour Guide
Ask me questions while you tour the home.