1100 Sunset Dr Beresford, SD 57004
Estimated Value: $311,000 - $434,000
5
Beds
2
Baths
2,532
Sq Ft
$141/Sq Ft
Est. Value
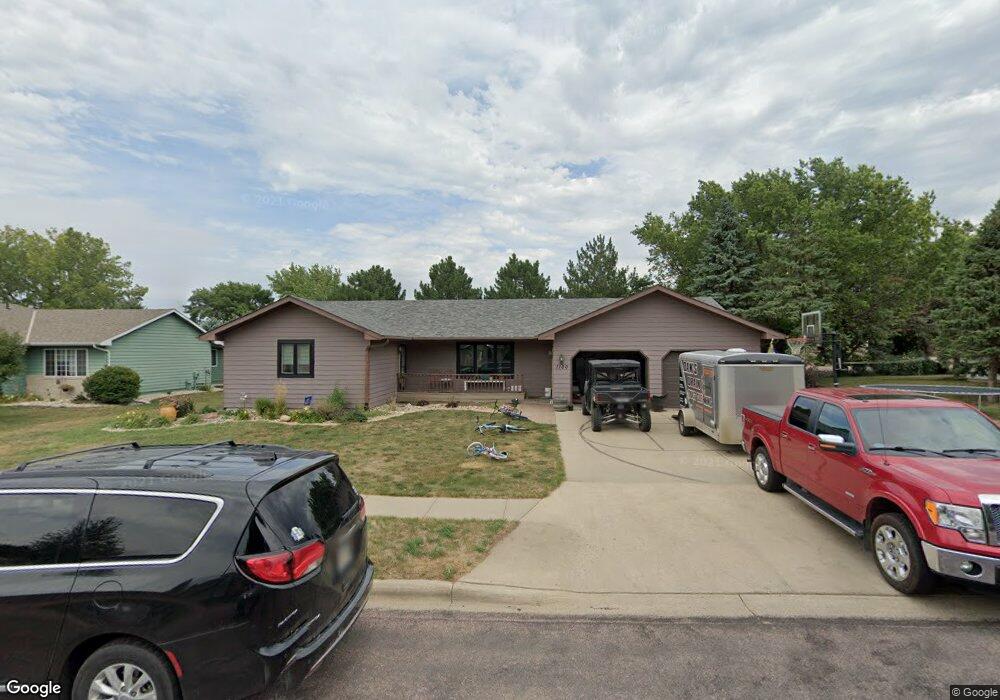
About This Home
This home is located at 1100 Sunset Dr, Beresford, SD 57004 and is currently estimated at $356,528, approximately $140 per square foot. 1100 Sunset Dr is a home located in Union County with nearby schools including Beresford Elementary School, Beresford Middle School, and Beresford High School.
Ownership History
Date
Name
Owned For
Owner Type
Purchase Details
Closed on
Aug 14, 2020
Sold by
Nelson Kevin G and Nelson Dyan C
Bought by
Schurch Michael John and Schurch Natosha
Current Estimated Value
Home Financials for this Owner
Home Financials are based on the most recent Mortgage that was taken out on this home.
Original Mortgage
$260,680
Outstanding Balance
$184,687
Interest Rate
2.9%
Mortgage Type
New Conventional
Estimated Equity
$171,841
Create a Home Valuation Report for This Property
The Home Valuation Report is an in-depth analysis detailing your home's value as well as a comparison with similar homes in the area
Purchase History
| Date | Buyer | Sale Price | Title Company |
|---|---|---|---|
| Schurch Michael John | $274,500 | Getty Abstract & Title Co |
Source: Public Records
Mortgage History
| Date | Status | Borrower | Loan Amount |
|---|---|---|---|
| Open | Schurch Michael John | $260,680 |
Source: Public Records
Tax History
| Year | Tax Paid | Tax Assessment Tax Assessment Total Assessment is a certain percentage of the fair market value that is determined by local assessors to be the total taxable value of land and additions on the property. | Land | Improvement |
|---|---|---|---|---|
| 2025 | $3,659 | $267,055 | $39,734 | $227,321 |
| 2024 | $3,702 | $267,055 | $39,734 | $227,321 |
| 2023 | $3,831 | $246,389 | $39,734 | $206,655 |
| 2022 | $3,212 | $237,197 | $30,542 | $206,655 |
| 2021 | $3,150 | $193,903 | $26,558 | $167,345 |
| 2020 | $3,292 | $185,934 | $26,558 | $159,376 |
| 2019 | $3,129 | $195,189 | $35,813 | $159,376 |
| 2018 | $3,124 | $192,155 | $35,813 | $156,342 |
| 2017 | $2,968 | $192,155 | $0 | $192,155 |
| 2016 | $3,119 | $176,273 | $0 | $176,273 |
| 2015 | $3,119 | $176,273 | $0 | $176,273 |
| 2014 | $3,080 | $176,273 | $0 | $176,273 |
| 2013 | $3,049 | $176,273 | $0 | $176,273 |
| 2012 | $3,049 | $176,273 | $32,557 | $143,716 |
Source: Public Records
Map
Nearby Homes
- 1130 Sunset Dr
- 1140 Sunset Dr
- 511 W Main St
- 500 W Spruce St
- 505 W Cedar St
- 411 S 6th St
- 305 W Elm St
- 308 W Hemlock St
- 206 W Hemlock St
- 208 S 3rd St
- 200 S 3rd St
- 0 4th St Unit 22601426
- 0 4th St Unit 22601427
- 403 S 2nd St
- 600 S 3rd St
- 606 S 3rd St
- 47138 298th St
- 307 S 1st St
- 201 W Willow St
- 405 SE 13th St
Your Personal Tour Guide
Ask me questions while you tour the home.