1101 E 22nd St Muncie, IN 47302
Southside NeighborhoodEstimated Value: $123,000 - $138,000
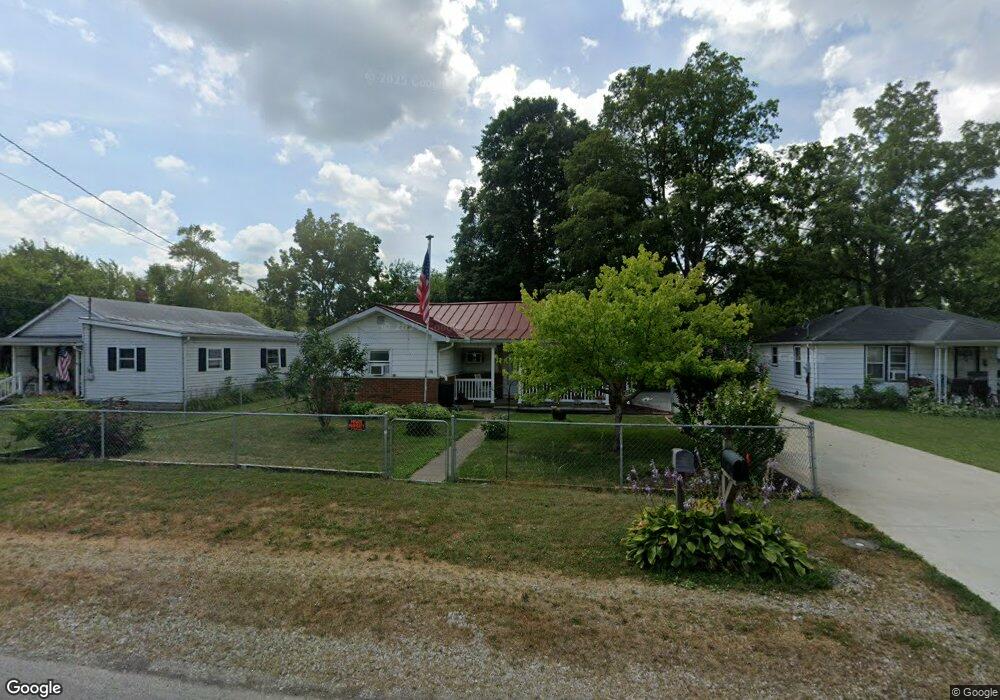
About This Home
This home is located at 1101 E 22nd St, Muncie, IN 47302 and is currently estimated at $128,429, approximately $89 per square foot. 1101 E 22nd St is a home located in Delaware County with nearby schools including Grissom Memorial Elementary School, Muncie Central High School, and Southside Middle School.
Ownership History
We collect this data history from publicly available records. To have your information removed, we recommend requesting removal directly through your county’s website.
Purchase Details
Home Financials for this Owner
Home Financials are based on the most recent Mortgage that was taken out on this home.Home Values in the Area
Average Home Value in this Area
Purchase History
We collect this data history from publicly available records. To have your information removed, we recommend requesting removal directly through your county’s website.
| Date | Buyer | Sale Price | Title Company |
|---|---|---|---|
| -- | None Available |
Mortgage History
We collect this data history from publicly available records. To have your information removed, we recommend requesting removal directly through your county’s website.
| Date | Status | Borrower | Loan Amount |
|---|---|---|---|
| Closed | $38,400 |
Tax History
We collect this data history from publicly available records. To have your information removed, we recommend requesting removal directly through your county’s website.
| Year | Tax Paid | Tax Assessment Tax Assessment Total Assessment is a certain percentage of the fair market value that is determined by local assessors to be the total taxable value of land and additions on the property. | Land | Improvement |
|---|---|---|---|---|
| 2025 | $635 | $91,800 | $6,400 | $85,400 |
| 2024 | $322 | $73,000 | $6,400 | $66,600 |
| 2023 | $305 | $73,000 | $6,400 | $66,600 |
| 2022 | $246 | $62,700 | $6,400 | $56,300 |
| 2021 | $470 | $77,300 | $9,100 | $68,200 |
| 2020 | $201 | $60,000 | $8,200 | $51,800 |
| 2019 | $271 | $60,000 | $8,200 | $51,800 |
| 2018 | $262 | $60,000 | $8,200 | $51,800 |
| 2017 | $257 | $59,700 | $8,600 | $51,100 |
| 2016 | $262 | $59,700 | $8,600 | $51,100 |
| 2014 | $171 | $57,900 | $8,200 | $49,700 |
| 2013 | -- | $57,300 | $8,200 | $49,100 |
Map
- 2802 S Hackley St
- 1800 BLK E 23rd St
- 3109 S Hackley St
- 3111 S Pershing Dr
- 1103 E 25th St
- 1503 E 21st St
- 2411 S Ebright St
- 2314 S Ebright St
- 2309 S Grant St
- 2704 S Macedonia Ave
- 3505 S Ebright St
- 1713 E 24th St
- 1710 E 22nd St
- 2210 S Pershing Dr
- 3202 S Jefferson St
- 1801 E 24th St
- 2117 S Beacon St
- 1804 E 25th St
- 2205 S Vine St
- 401 E 27th St
Ask me questions while you tour the home.