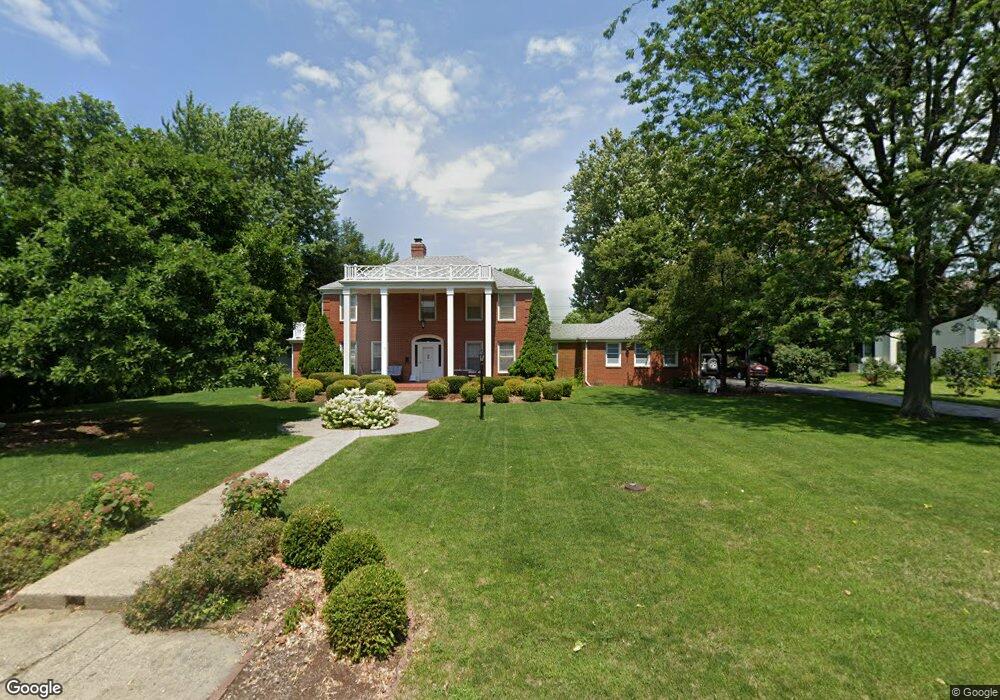
1101 E 6th St Fowler, IN 47944
Estimated Value: $256,000 - $291,000
3
Beds
2
Baths
2,146
Sq Ft
$124/Sq Ft
Est. Value
About This Home
This home is located at 1101 E 6th St, Fowler, IN 47944 and is currently estimated at $266,951, approximately $124 per square foot. 1101 E 6th St is a home located in Benton County with nearby schools including Benton Central Junior/Senior High School and Sacred Heart Elementary School.
Ownership History
Date
Name
Owned For
Owner Type
Purchase Details
Closed on
Oct 4, 2024
Sold by
Gerlach James R and Gerlach Patrice A
Bought by
Knotts Morgan L and Knotts Charity A
Current Estimated Value
Home Financials for this Owner
Home Financials are based on the most recent Mortgage that was taken out on this home.
Original Mortgage
$215,000
Outstanding Balance
$211,736
Interest Rate
6.46%
Mortgage Type
New Conventional
Estimated Equity
$55,215
Purchase Details
Closed on
Sep 8, 2000
Sold by
Not Provided
Bought by
Not Provided
Purchase Details
Closed on
Oct 17, 1995
Sold by
Not Provided
Bought by
Not Provided
Create a Home Valuation Report for This Property
The Home Valuation Report is an in-depth analysis detailing your home's value as well as a comparison with similar homes in the area
Purchase History
We collect this data history from publicly available records. To have your information removed, we recommend requesting removal directly through your county’s website.
| Date | Buyer | Sale Price | Title Company |
|---|---|---|---|
| Knotts Morgan L | $249,000 | None Listed On Document | |
| Not Provided | $122,000 | -- | |
| Not Provided | $105,000 | -- |
Source: Public Records
Mortgage History
We collect this data history from publicly available records. To have your information removed, we recommend requesting removal directly through your county’s website.
| Date | Status | Borrower | Loan Amount |
|---|---|---|---|
| Open | Knotts Morgan L | $215,000 |
Source: Public Records
Tax History
| Year | Tax Paid | Tax Assessment Tax Assessment Total Assessment is a certain percentage of the fair market value that is determined by local assessors to be the total taxable value of land and additions on the property. | Land | Improvement |
|---|---|---|---|---|
| 2025 | $3,024 | $255,700 | $14,200 | $241,500 |
| 2024 | $3,024 | $291,800 | $14,200 | $277,600 |
| 2023 | $3,053 | $265,500 | $15,200 | $250,300 |
| 2022 | $2,303 | $197,400 | $15,200 | $182,200 |
| 2021 | $1,865 | $161,000 | $15,200 | $145,800 |
| 2020 | $1,523 | $140,900 | $15,200 | $125,700 |
| 2019 | $1,590 | $156,800 | $15,200 | $141,600 |
| 2018 | $1,365 | $138,500 | $15,200 | $123,300 |
| 2017 | $1,380 | $136,000 | $15,200 | $120,800 |
| 2016 | $1,259 | $123,900 | $15,200 | $108,700 |
| 2014 | $1,086 | $106,800 | $14,700 | $92,100 |
| 2013 | $1,086 | $100,700 | $14,000 | $86,700 |
Source: Public Records
Map
Nearby Homes
- 1110 E 6th St
- 902 E 8th St
- 801 E 4th St
- 503 S Park Dr
- 602 S Park Dr
- 305 N Lincoln Ave
- 700 S Sharon Ave
- 502 E 5th St
- 601 E 3rd St
- 107 N Jackson Ave
- 503 E 8th St
- 105 N Van Buren Ave
- 310 E 7th St
- 1209 E 13th St
- 208 E 6th St
- 305 N Madison Ave
- 307 N Madison Ave
- 1110 E Lingle St
- 306 N Jefferson Ave
- 703 W 2nd St
Your Personal Tour Guide
Ask me questions while you tour the home.