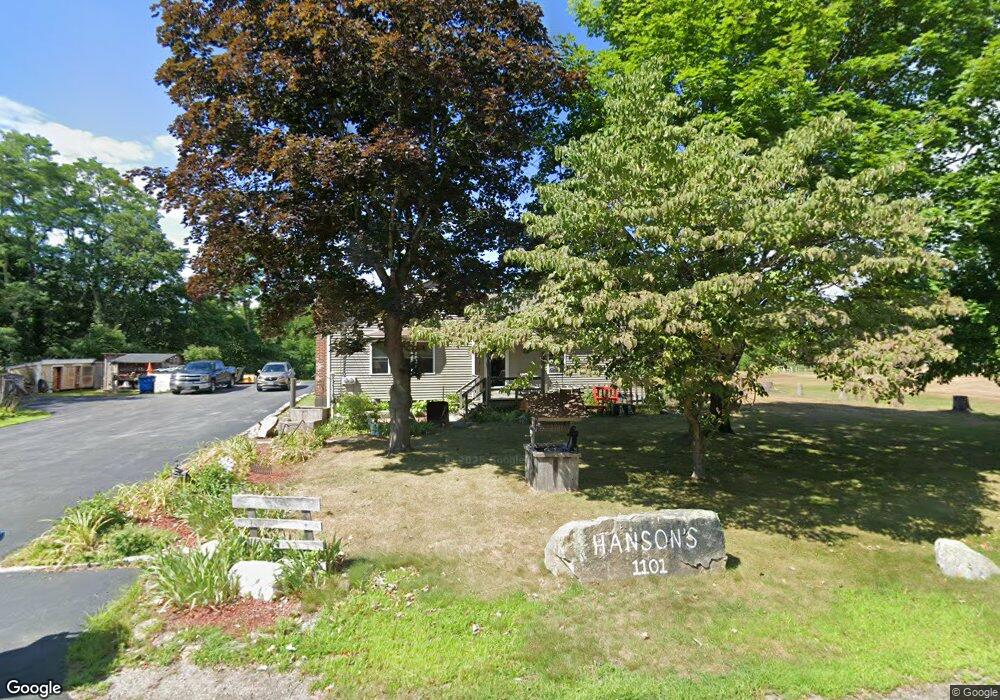
1101 Quaker St Northbridge, MA 01534
Estimated Value: $478,387 - $551,000
About This Home
This home is located at 1101 Quaker St, Northbridge, MA 01534 and is currently estimated at $508,097, approximately $332 per square foot. 1101 Quaker St is a home located in Worcester County with nearby schools including Northbridge Elementary School, Northbridge Middle School, and Northbridge High School.
Ownership History
We collect this data history from publicly available records. To have your information removed, we recommend requesting removal directly through your county’s website.
Purchase Details
Purchase Details
Home Values in the Area
Average Home Value in this Area
Purchase History
We collect this data history from publicly available records. To have your information removed, we recommend requesting removal directly through your county’s website.
| Date | Buyer | Sale Price | Title Company |
|---|---|---|---|
| -- | None Available | ||
| -- | None Available | ||
| -- | None Available | ||
| -- | -- |
Mortgage History
We collect this data history from publicly available records. To have your information removed, we recommend requesting removal directly through your county’s website.
| Date | Status | Borrower | Loan Amount |
|---|---|---|---|
| Previous Owner | $85,000 | ||
| Previous Owner | $58,581 |
Tax History
We collect this data history from publicly available records. To have your information removed, we recommend requesting removal directly through your county’s website.
| Year | Tax Paid | Tax Assessment Tax Assessment Total Assessment is a certain percentage of the fair market value that is determined by local assessors to be the total taxable value of land and additions on the property. | Land | Improvement |
|---|---|---|---|---|
| 2025 | $5,163 | $437,900 | $155,400 | $282,500 |
| 2024 | $5,013 | $414,600 | $155,400 | $259,200 |
| 2023 | $5,200 | $401,200 | $155,400 | $245,800 |
| 2022 | $4,785 | $347,500 | $119,600 | $227,900 |
| 2021 | $4,692 | $323,800 | $114,000 | $209,800 |
| 2020 | $4,357 | $314,800 | $114,000 | $200,800 |
| 2019 | $2,080 | $300,400 | $114,000 | $186,400 |
| 2018 | $3,701 | $286,000 | $108,400 | $177,600 |
| 2017 | $3,691 | $272,800 | $108,400 | $164,400 |
| 2016 | $3,527 | $256,500 | $98,500 | $158,000 |
| 2015 | $3,437 | $256,900 | $98,500 | $158,400 |
| 2014 | $3,406 | $256,900 | $98,500 | $158,400 |
Map
- 19 Monica Way
- Lot 23 Monica Way
- 173 Rolling Ridge Dr Unit 99
- Lot 16 Monica Way
- 164 Rolling Ridge Dr Unit 102
- 162 Rolling Ridge Dr Unit 103
- 12 Valerie Run
- 48 Crestwood Cir Unit 26
- 608 Church St
- 45 Highland St
- 3 Moon Hill Rd
- 50 Roy St
- 579 Church St
- 556 Church St
- 378 Moon Hill Rd
- 135 Rolling Ridge Dr Unit 56
- 170 Stone Hill Dr Unit 170
- 304 Quaker St
- 106 Sherry St
- 1617 Providence Rd
- 11 Forsythe Farm Rd
- 26 Forsythe Farm Rd
- 1131 Quaker St
- 31 Forsythe Farm Rd
- 1136 Quaker St
- 118 Forsythe Farm Rd
- 132 Forsythe Farm Rd
- 4A Mendon St
- 3A Mendon St
- 93 Forsythe Farm Rd
- 2 Mendon Rd
- 0 Mendon Rd
- 0 Mendon Rd Unit 72906937
- 0 Mendon Rd Unit 72641382
- 76 Mendon Rd
- 11 Mendon Rd
- 160 Forsythe Farm Rd
- 1046 Quaker St
- 1 Mendon Rd
- 1 Mendon Rd
Ask me questions while you tour the home.