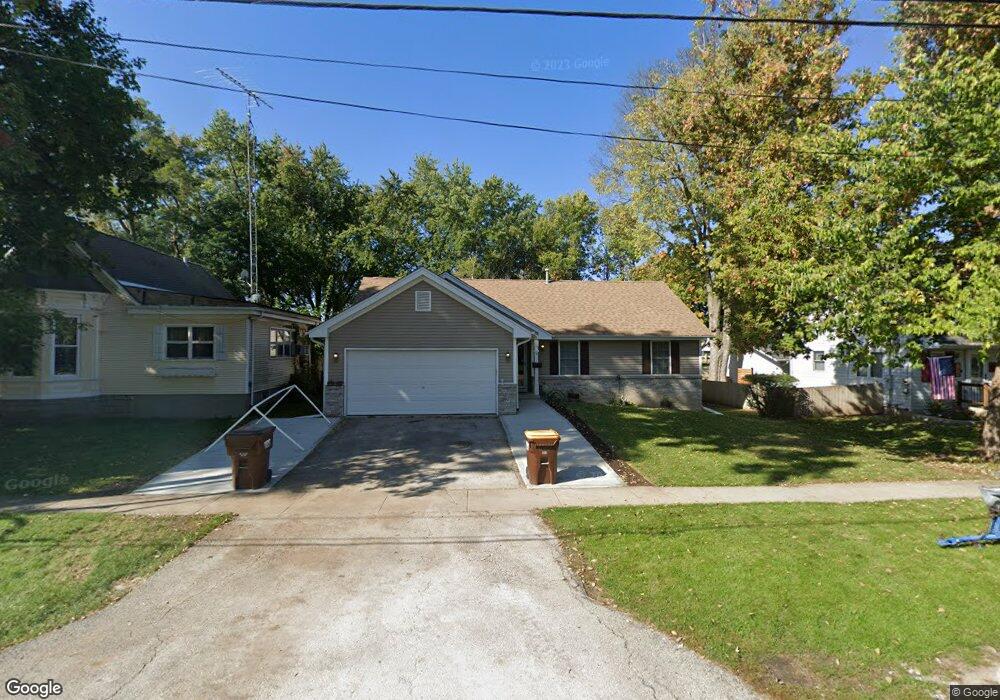
1105 Maple Ave Belvidere, IL 61008
Estimated Value: $206,000 - $218,000
3
Beds
2
Baths
1,330
Sq Ft
$159/Sq Ft
Est. Value
About This Home
This home is located at 1105 Maple Ave, Belvidere, IL 61008 and is currently estimated at $211,758, approximately $159 per square foot. 1105 Maple Ave is a home located in Boone County with nearby schools including Washington Academy, Belvidere South Middle School, and Belvidere High School.
Ownership History
Date
Name
Owned For
Owner Type
Purchase Details
Closed on
Sep 22, 2023
Sold by
Angie Wait Real Estate Llc
Bought by
Smith Kevin L
Current Estimated Value
Home Financials for this Owner
Home Financials are based on the most recent Mortgage that was taken out on this home.
Original Mortgage
$166,258
Outstanding Balance
$161,694
Interest Rate
7.25%
Mortgage Type
Construction
Estimated Equity
$50,064
Purchase Details
Closed on
Mar 28, 2007
Bought by
Redeker Ken and Wait-Weber Angie
Create a Home Valuation Report for This Property
The Home Valuation Report is an in-depth analysis detailing your home's value as well as a comparison with similar homes in the area
Home Values in the Area
Average Home Value in this Area
Purchase History
We collect this data history from publicly available records. To have your information removed, we recommend requesting removal directly through your county’s website.
| Date | Buyer | Sale Price | Title Company |
|---|---|---|---|
| Smith Kevin L | $171,400 | Title Underwriters Agency | |
| Redeker Ken | $27,500 | -- |
Source: Public Records
Mortgage History
We collect this data history from publicly available records. To have your information removed, we recommend requesting removal directly through your county’s website.
| Date | Status | Borrower | Loan Amount |
|---|---|---|---|
| Open | Smith Kevin L | $166,258 |
Source: Public Records
Tax History
| Year | Tax Paid | Tax Assessment Tax Assessment Total Assessment is a certain percentage of the fair market value that is determined by local assessors to be the total taxable value of land and additions on the property. | Land | Improvement |
|---|---|---|---|---|
| 2024 | $4,927 | $61,537 | $3,844 | $57,693 |
| 2023 | $4,801 | $52,984 | $5,894 | $47,090 |
| 2022 | $4,127 | $48,618 | $5,894 | $42,724 |
| 2021 | $4,477 | $46,123 | $5,894 | $40,229 |
| 2020 | $3,624 | $41,142 | $6,214 | $34,928 |
| 2019 | $4,343 | $59,784 | $24,856 | $34,928 |
| 2018 | $4,198 | $152,092 | $120,283 | $31,809 |
| 2017 | $4,066 | $38,212 | $6,512 | $31,700 |
| 2016 | $4,061 | $36,607 | $6,406 | $30,201 |
| 2015 | $3,910 | $34,269 | $8,008 | $26,261 |
| 2014 | $2,210 | $35,109 | $8,008 | $27,101 |
Source: Public Records
Map
Nearby Homes
- 407 Allen St
- 1315 Union Ave
- 1121 8th Ave
- 1419 7th Ave
- 1421 Garfield Ave
- 601 Pearl St
- 632 O'Connell Ct
- 112 W 2nd St
- 900 Whitney Blvd
- 1126 Columbia Ave
- 1016 S Main St
- 143 Gladys Ct
- 625 W Hurlbut Ave
- 215 Fox Ln
- 525 W Hurlbut Ave
- 406 Laurel Place
- 715 E 3rd St
- 617 East Ave
- 350 Elder Ln
- 1240 S Appleton Rd
Your Personal Tour Guide
Ask me questions while you tour the home.