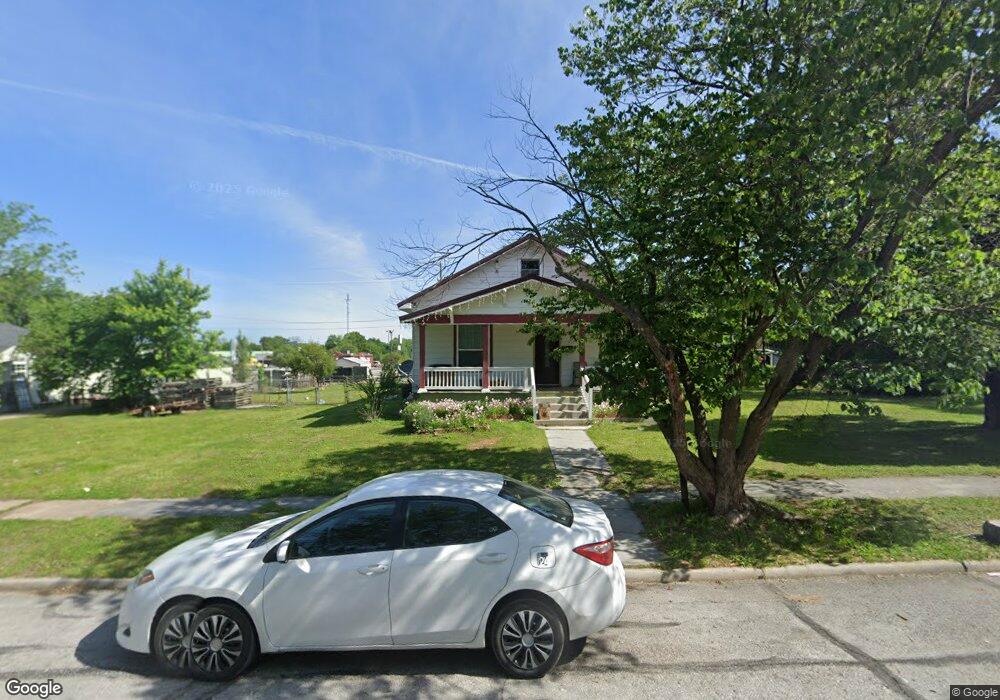
1109 Olive St Carthage, MO 64836
Estimated Value: $137,000 - $153,000
About This Home
This home is located at 1109 Olive St, Carthage, MO 64836 and is currently estimated at $145,444, approximately $118 per square foot. 1109 Olive St is a home located in Jasper County with nearby schools including Carthage High School, Victory Academy, and St. Ann's Catholic School.
Ownership History
We collect this data history from publicly available records. To have your information removed, we recommend requesting removal directly through your county’s website.
Purchase Details
Purchase Details
Purchase Details
Purchase Details
Home Values in the Area
Average Home Value in this Area
Purchase History
We collect this data history from publicly available records. To have your information removed, we recommend requesting removal directly through your county’s website.
| Date | Buyer | Sale Price | Title Company |
|---|---|---|---|
| -- | None Listed On Document | ||
| -- | Fatco | ||
| -- | None Available | ||
| $19,999 | None Available |
Tax History
We collect this data history from publicly available records. To have your information removed, we recommend requesting removal directly through your county’s website.
| Year | Tax Paid | Tax Assessment Tax Assessment Total Assessment is a certain percentage of the fair market value that is determined by local assessors to be the total taxable value of land and additions on the property. | Land | Improvement |
|---|---|---|---|---|
| 2025 | $587 | $12,740 | $2,380 | $10,360 |
| 2024 | $587 | $11,410 | $2,380 | $9,030 |
| 2023 | $587 | $11,410 | $2,380 | $9,030 |
| 2022 | $575 | $11,200 | $2,380 | $8,820 |
| 2021 | $568 | $11,200 | $2,380 | $8,820 |
| 2020 | $554 | $10,460 | $2,380 | $8,080 |
| 2019 | $555 | $10,460 | $2,380 | $8,080 |
| 2018 | $553 | $10,460 | $0 | $0 |
| 2017 | $555 | $10,460 | $0 | $0 |
| 2016 | $553 | $10,460 | $0 | $0 |
| 2015 | $475 | $9,710 | $0 | $0 |
| 2014 | $475 | $9,710 | $0 | $0 |
Map
- 1114 Olive St
- 1004 Oak St
- 1107 Grove St Unit 1109
- 503 S Francis St
- 1415 Olive St
- 527 Walnut St
- 524 Walnut St
- 428 W Vine St
- 907 S Mcgregor St
- 703 W Macon St
- 1206 Douglas Ct
- 813 Lyon St
- 1420 Foundry Dr
- 510 Miller St
- 903 S Main St
- 1129 S Maple St
- 1225 Douglas Ct
- 1131 Lyon St
- 210 Meridian St
- 1135 Lyon St
Ask me questions while you tour the home.