Estimated Value: $276,000 - $354,000
2
Beds
2
Baths
850
Sq Ft
$356/Sq Ft
Est. Value
About This Home
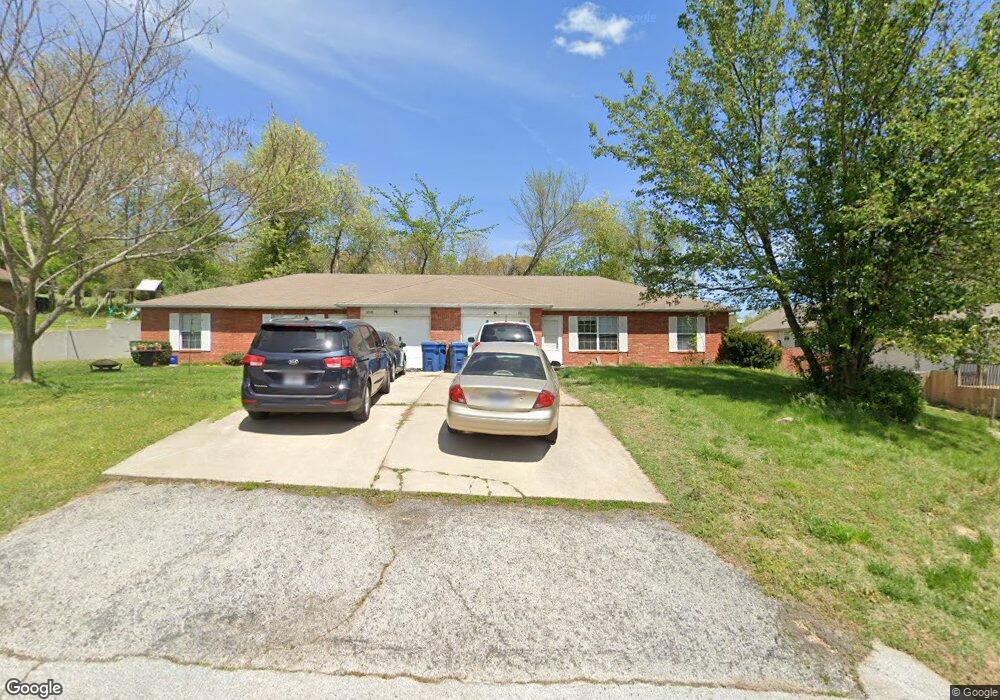
This home is located at 111 E Mills Rd, Nixa, MO 65714 and is currently estimated at $303,000, approximately $356 per square foot. 111 E Mills Rd is a home located in Christian County with nearby schools including Century Elementary School, Summit Intermediate School, and Nixa Junior High School.
Ownership History
Date
Name
Owned For
Owner Type
Purchase Details
Closed on
Sep 30, 2019
Sold by
Quadcore Investments Llc
Bought by
Bmak Llc
Current Estimated Value
Home Financials for this Owner
Home Financials are based on the most recent Mortgage that was taken out on this home.
Original Mortgage
$467,600
Outstanding Balance
$406,005
Interest Rate
3.5%
Mortgage Type
Commercial
Estimated Equity
-$103,005
Purchase Details
Closed on
Aug 31, 2018
Sold by
American Marketing Systems Inc
Bought by
Quadcore Investments Llc
Home Financials for this Owner
Home Financials are based on the most recent Mortgage that was taken out on this home.
Original Mortgage
$89,250
Interest Rate
4.5%
Mortgage Type
Commercial
Create a Home Valuation Report for This Property
The Home Valuation Report is an in-depth analysis detailing your home's value as well as a comparison with similar homes in the area
Home Values in the Area
Average Home Value in this Area
Purchase History
| Date | Buyer | Sale Price | Title Company |
|---|---|---|---|
| Bmak Llc | -- | Hogan Land Title Company | |
| Quadcore Investments Llc | -- | Hogan Land Title Company |
Source: Public Records
Mortgage History
| Date | Status | Borrower | Loan Amount |
|---|---|---|---|
| Open | Bmak Llc | $467,600 | |
| Previous Owner | Quadcore Investments Llc | $89,250 |
Source: Public Records
Tax History
| Year | Tax Paid | Tax Assessment Tax Assessment Total Assessment is a certain percentage of the fair market value that is determined by local assessors to be the total taxable value of land and additions on the property. | Land | Improvement |
|---|---|---|---|---|
| 2025 | $1,609 | $27,510 | -- | -- |
| 2024 | $1,609 | $25,820 | -- | -- |
| 2023 | $1,609 | $25,820 | -- | -- |
| 2022 | $1,516 | $24,300 | $0 | $0 |
| 2021 | $1,517 | $24,300 | $0 | $0 |
| 2020 | $1,482 | $22,650 | $0 | $0 |
| 2019 | $1,482 | $22,650 | $0 | $0 |
| 2018 | $1,380 | $22,650 | $0 | $0 |
| 2017 | $1,380 | $22,650 | $0 | $0 |
| 2016 | $1,359 | $22,650 | $0 | $0 |
| 2015 | $1,361 | $22,650 | $22,650 | $0 |
| 2014 | $1,315 | $22,440 | $0 | $0 |
| 2013 | $13 | $22,440 | $0 | $0 |
| 2011 | $13 | $44,880 | $0 | $0 |
Source: Public Records
Map
Nearby Homes
- 111 Daleview Cir
- 209 Shady Acres Cir
- 000 Croley Blvd Unit Lots 12,13, 14
- 512 Baldknobber St
- 827 Gold Rush Ave
- 845 S Black Sands
- 849 S Cobble Creek Blvd
- 000 Citydel Rd W
- 825 S Cobble Creek Blvd
- 704 E Placer Mill Rd
- 822 S Eastridge
- 719 S Lantern Ridge
- 601 Carriage Crossing
- 829 S Parkside Cir
- 108 E Church Hill Ct
- 424 S Southgate Dr
- 867 S Irontree Ct
- 667 W Castor
- 821 S Ridgemont Dr Unit Lot 214
- 827 S Ridgemont Dr Unit Lot 211
Your Personal Tour Guide
Ask me questions while you tour the home.