
Seller's Agent in 2025
Ryan Tooker
C21 CHARLES SMITH AGENCY, INC
(732) 925-9111
1 in this area
117 Total Sales
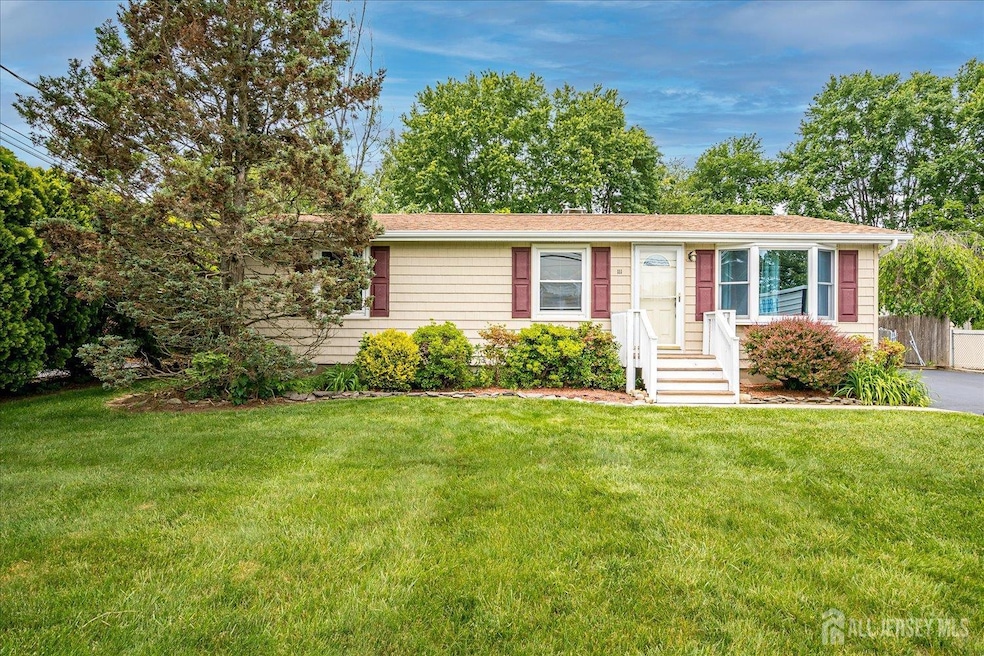
Charmingly updated 3-bedroom, 1-bath ranch situated on an expansive lot. This well-maintained home features updated laminate flooring and brand-new carpeting in select bedrooms. The renovated eat-in kitchen boasts granite countertops, a stylish backsplash, white cabinetry and appliances, all of which are included in the sale. Additional updates include: siding/window redone in 2009, kitchen redone 2016. new furnace installed within the past 6 months. A washer and dryer are also included for added convenience. The home offers ample storage with attic storage and a crawl space. Step out from the kitchen onto a cozy deck that opens to a spacious concrete patio-ideal for outdoor entertaining. Toward the back of the property, an oversized shed provides the perfect space for a workshop or additional storage. A spacious five-car driveway completes this impressive offering, providing ample parking for residents and guests alike. Conveniently located just moments from local parks and businesses, this property combines comfort, functionality, and a great location.
| Date | Type | Sale Price | Title Company |
|---|---|---|---|
| Deed | $475,000 | None Listed On Document | |
| Deed | $475,000 | None Listed On Document | |
| Deed | $102,000 | -- |
| Date | Status | Loan Amount | Loan Type |
|---|---|---|---|
| Open | $451,250 | New Conventional | |
| Closed | $451,250 | New Conventional | |
| Previous Owner | $97,000 | No Value Available |
| Date | Event | Price | List to Sale | Price per Sq Ft |
|---|---|---|---|---|
| 07/15/2025 07/15/25 | Sold | $475,000 | +5.6% | $471 / Sq Ft |
| 05/28/2025 05/28/25 | For Sale | $450,000 | 0.0% | $446 / Sq Ft |
| 05/21/2025 05/21/25 | Off Market | $450,000 | -- | -- |
| Year | Tax Paid | Tax Assessment Tax Assessment Total Assessment is a certain percentage of the fair market value that is determined by local assessors to be the total taxable value of land and additions on the property. | Land | Improvement |
|---|---|---|---|---|
| 2025 | $6,442 | $190,100 | $119,000 | $71,100 |
| 2024 | $6,201 | $190,100 | $119,000 | $71,100 |
| 2023 | $6,201 | $190,100 | $119,000 | $71,100 |
| 2022 | $6,146 | $190,100 | $119,000 | $71,100 |
| 2021 | $3,981 | $190,100 | $119,000 | $71,100 |
| 2020 | $5,821 | $190,100 | $119,000 | $71,100 |
| 2019 | $5,872 | $190,100 | $119,000 | $71,100 |
| 2018 | $5,796 | $190,100 | $119,000 | $71,100 |
| 2017 | $5,690 | $190,100 | $119,000 | $71,100 |
| 2016 | $5,463 | $190,100 | $119,000 | $71,100 |
| 2015 | $5,218 | $190,100 | $119,000 | $71,100 |
| 2014 | $5,157 | $190,100 | $119,000 | $71,100 |
Seller's Agent in 2025
Ryan Tooker
C21 CHARLES SMITH AGENCY, INC
(732) 925-9111
1 in this area
117 Total Sales
Source: All Jersey MLS
MLS Number: 2513692R
APN: 06-00018-0000-00003-06
Disclaimer: Certain information contained herein is derived from information provided by parties other than Homes.com. All information provided is deemed reliable, but is not guaranteed to be accurate and should be independently verified.
![]() The data relating to real estate for sale on this web-site comes in part from the Internet Listing Display database of the CENTRAL JERSEY MULTIPLE LISTING SYSTEM, INC. Real estate listings held by brokerage firms other than this site-owner are marked with the ILD logo. The CENTRAL JERSEY MULTIPLE LISTING SYSTEM, INC does not warrant the accuracy, quality, reliability, suitability, completeness, usefulness or effectiveness of any information provided.
The data relating to real estate for sale on this web-site comes in part from the Internet Listing Display database of the CENTRAL JERSEY MULTIPLE LISTING SYSTEM, INC. Real estate listings held by brokerage firms other than this site-owner are marked with the ILD logo. The CENTRAL JERSEY MULTIPLE LISTING SYSTEM, INC does not warrant the accuracy, quality, reliability, suitability, completeness, usefulness or effectiveness of any information provided.
Copyright 2026, CENTRAL JERSEY MULTIPLE LISTING SYSTEM, INC All rights reserved
The CENTRAL JERSEY MULTIPLE LISTING SYSTEM, INC retains all rights, title and interest in and to its trademarks, service marks and copyrighted material.
The information being provided is for consumers' personal, non-commercial use and may not be used for any purpose other than to identify properties the consumer may be interested in purchasing or renting.
Ask me questions while you tour the home.