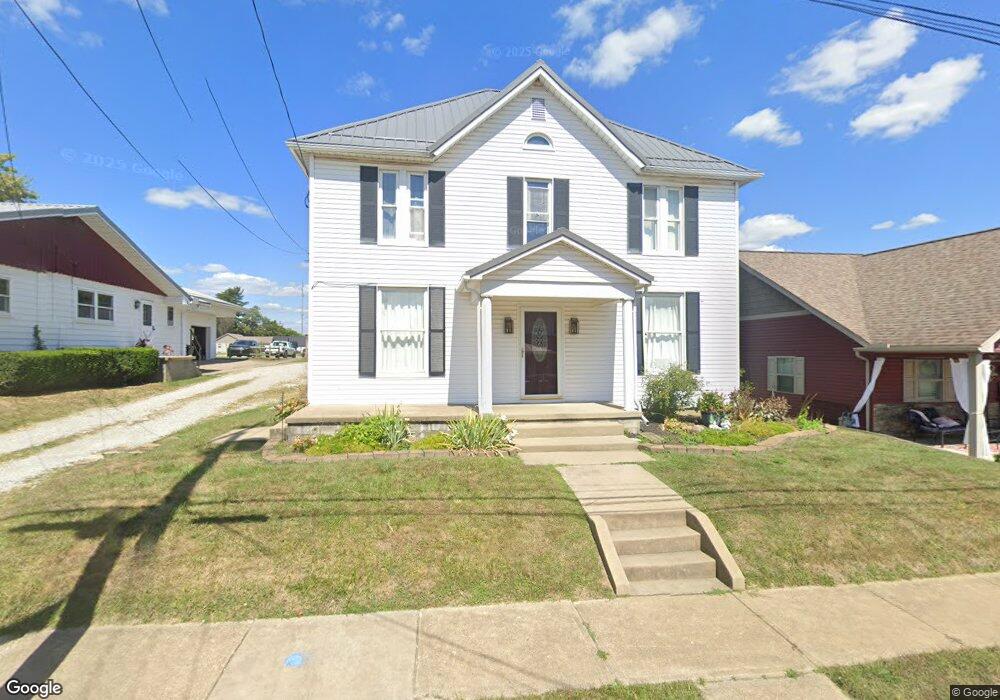
111 Maple Ave Bethesda, OH 43719
Estimated Value: $153,626 - $238,000
4
Beds
2
Baths
1,912
Sq Ft
$103/Sq Ft
Est. Value
About This Home
This home is located at 111 Maple Ave, Bethesda, OH 43719 and is currently estimated at $196,407, approximately $102 per square foot. 111 Maple Ave is a home located in Belmont County with nearby schools including Union Local Elementary School, Union Local Middle School, and Union Local High School.
Ownership History
Date
Name
Owned For
Owner Type
Purchase Details
Closed on
Feb 23, 2011
Sold by
Allar Ryan H and Allar Bridget C
Bought by
Hatcher Michael T
Current Estimated Value
Home Financials for this Owner
Home Financials are based on the most recent Mortgage that was taken out on this home.
Original Mortgage
$80,800
Outstanding Balance
$54,599
Interest Rate
4.75%
Mortgage Type
FHA
Estimated Equity
$141,808
Purchase Details
Closed on
Oct 22, 2003
Sold by
Allar Ryan B
Bought by
Allar Ryan B
Purchase Details
Closed on
Jan 1, 1986
Sold by
Peters Steven B and Peters Mariann
Bought by
Peters Steven B and Peters Mariann
Create a Home Valuation Report for This Property
The Home Valuation Report is an in-depth analysis detailing your home's value as well as a comparison with similar homes in the area
Purchase History
| Date | Buyer | Sale Price | Title Company |
|---|---|---|---|
| Hatcher Michael T | $83,000 | Attorney | |
| Allar Ryan B | $72,500 | -- | |
| Peters Steven B | -- | -- |
Source: Public Records
Mortgage History
| Date | Status | Borrower | Loan Amount |
|---|---|---|---|
| Open | Hatcher Michael T | $80,800 |
Source: Public Records
Tax History
| Year | Tax Paid | Tax Assessment Tax Assessment Total Assessment is a certain percentage of the fair market value that is determined by local assessors to be the total taxable value of land and additions on the property. | Land | Improvement |
|---|---|---|---|---|
| 2025 | $1,734 | $47,740 | $2,130 | $45,610 |
| 2023 | $1,071 | $28,250 | $1,630 | $26,620 |
| 2022 | $1,072 | $28,255 | $1,631 | $26,624 |
| 2021 | $1,067 | $28,255 | $1,631 | $26,624 |
| 2020 | $986 | $24,570 | $1,420 | $23,150 |
| 2019 | $952 | $24,570 | $1,420 | $23,150 |
| 2018 | $1,067 | $24,570 | $1,420 | $23,150 |
| 2017 | $1,187 | $29,560 | $1,540 | $28,020 |
| 2016 | $1,192 | $29,560 | $1,540 | $28,020 |
| 2015 | $1,224 | $29,560 | $1,540 | $28,020 |
| 2014 | $1,119 | $26,870 | $1,400 | $25,470 |
| 2013 | $997 | $26,870 | $1,400 | $25,470 |
Source: Public Records
Map
Nearby Homes
- 416 2nd St
- 101 Willow St
- 204 Oak St
- 0 Judson St Unit 5197436
- 201 Pear Unit Lot23
- 201 Pear Unit 9
- 430 S Main St
- 63054 & 63060 S 26 Rd
- 0 Belmont Centerville Rd
- 220 Market St
- 66164 Belmont Morristown Rd
- 39991 National Rd
- 0 National Rd
- 125 Chaplins Ln
- 38510 National Rd
- INLOT 19 Havenwood
- 67174 Pancoast Rd S
- 60945 Sandy Ridge Rd
- V/L Shephard Rd
- 0 Brown Peavine Rd Unit Tract 17
Your Personal Tour Guide
Ask me questions while you tour the home.