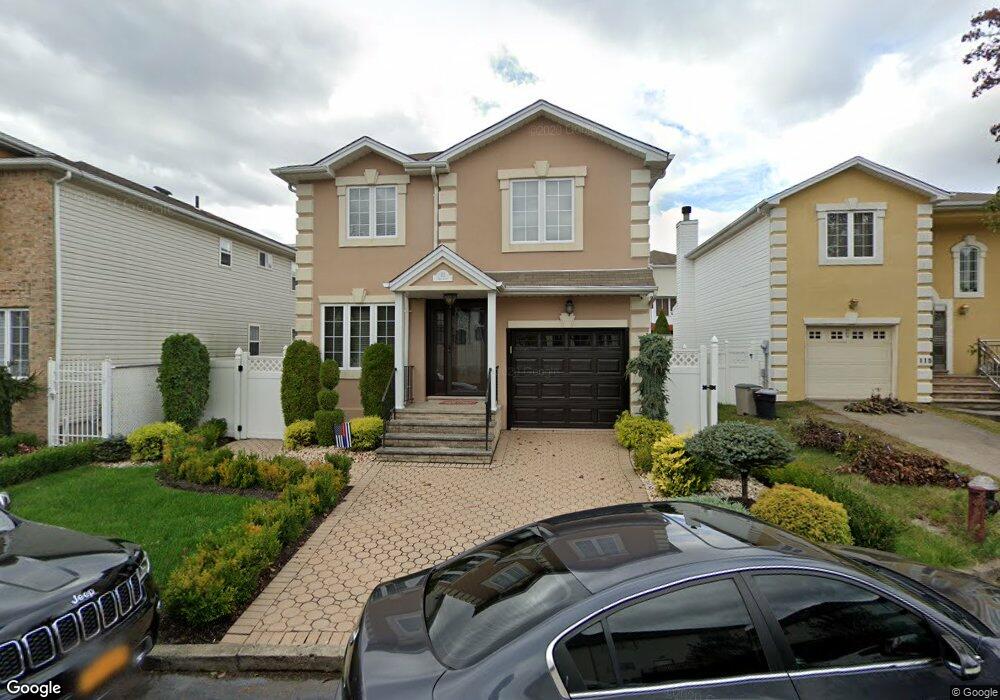
111 Savo Loop Staten Island, NY 10309
Pleasant Plains NeighborhoodEstimated Value: $920,084 - $1,052,000
Studio
4
Baths
2,025
Sq Ft
$488/Sq Ft
Est. Value
About This Home
This home is located at 111 Savo Loop, Staten Island, NY 10309 and is currently estimated at $988,771, approximately $488 per square foot. 111 Savo Loop is a home located in Richmond County with nearby schools including P.S. 3 - The Margaret Gioiosa School, Is 34 Tottenville, and Tottenville High School.
Ownership History
Date
Name
Owned For
Owner Type
Purchase Details
Closed on
Sep 23, 2016
Sold by
Azzato Kerri A
Bought by
Azzato Frank and Azzato Kerri A
Current Estimated Value
Home Financials for this Owner
Home Financials are based on the most recent Mortgage that was taken out on this home.
Original Mortgage
$69,048
Outstanding Balance
$54,377
Interest Rate
3.5%
Mortgage Type
New Conventional
Estimated Equity
$934,394
Purchase Details
Closed on
Jul 28, 2014
Sold by
Azzato Frank Joseph
Bought by
Azzato Kerri A
Purchase Details
Closed on
Dec 14, 2012
Sold by
Urbanek Family Limited Partnership
Bought by
Azzato Frank Joseph
Purchase Details
Closed on
Sep 24, 1998
Sold by
Sophia Homes Inc
Bought by
Urbanek Family Ltd Partnership
Create a Home Valuation Report for This Property
The Home Valuation Report is an in-depth analysis detailing your home's value as well as a comparison with similar homes in the area
Home Values in the Area
Average Home Value in this Area
Purchase History
| Date | Buyer | Sale Price | Title Company |
|---|---|---|---|
| Azzato Frank | -- | Chicago Title Insurance Co | |
| Azzato Kerri A | -- | None Available | |
| Azzato Frank Joseph | -- | None Available | |
| Urbanek Family Ltd Partnership | $310,000 | -- |
Source: Public Records
Mortgage History
| Date | Status | Borrower | Loan Amount |
|---|---|---|---|
| Open | Azzato Frank | $69,048 |
Source: Public Records
Tax History
| Year | Tax Paid | Tax Assessment Tax Assessment Total Assessment is a certain percentage of the fair market value that is determined by local assessors to be the total taxable value of land and additions on the property. | Land | Improvement |
|---|---|---|---|---|
| 2025 | $8,774 | $59,580 | $7,228 | $52,352 |
| 2024 | $8,774 | $54,120 | $7,507 | $46,613 |
| 2023 | $8,370 | $41,213 | $6,928 | $34,285 |
| 2022 | $8,124 | $48,600 | $9,300 | $39,300 |
| 2021 | $8,564 | $45,600 | $9,300 | $36,300 |
| 2020 | $8,168 | $50,400 | $9,300 | $41,100 |
| 2019 | $7,615 | $49,500 | $9,300 | $40,200 |
| 2018 | $7,001 | $34,344 | $7,383 | $26,961 |
| 2017 | $6,913 | $33,912 | $7,857 | $26,055 |
| 2016 | $6,779 | $33,912 | $7,132 | $26,780 |
| 2015 | $5,822 | $32,157 | $6,756 | $25,401 |
| 2014 | $5,822 | $30,337 | $7,643 | $22,694 |
Source: Public Records
Map
Nearby Homes
- 35 Savona Ct
- 107 Station Ave
- 6401 Amboy Rd
- 66 Pleasant Plains Ave
- 52 Pleasant Plains Ave
- 6321 Amboy Rd
- 10 Penton St
- 6716 Amboy Rd
- 145 Dunham St
- 52 Cranberry Ct
- 6401-6407 Amboy Rd
- 333 Boscombe Ave
- 18 Cranberry Ct
- 282 Boscombe Ave
- 6233 Amboy Rd
- 150 Weiner St
- 44 Cordelia Ave
- 60 Cordelia Ave
- 57 Churchill Ave
- 105 Churchill Ave
Your Personal Tour Guide
Ask me questions while you tour the home.