111 W Walnut St Chandler, IN 47610
Estimated Value: $74,745 - $187,000
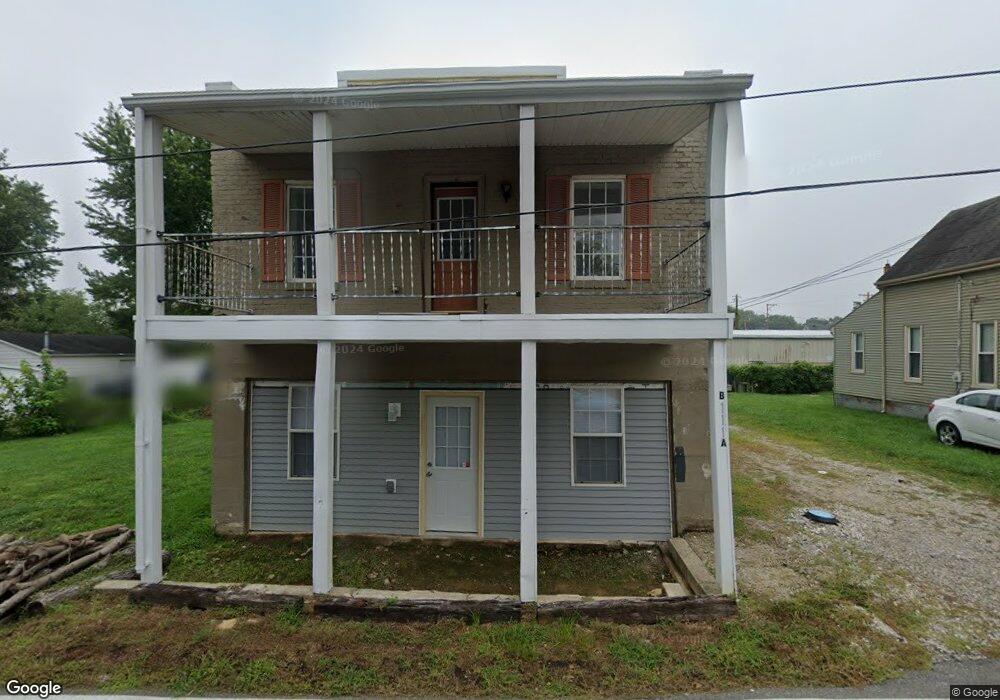
About This Home
This home is located at 111 W Walnut St, Chandler, IN 47610 and is currently estimated at $135,686, approximately $56 per square foot. 111 W Walnut St is a home located in Warrick County with nearby schools including Chandler Elementary School, Castle North Middle School, and Boonville Middle School.
Ownership History
We collect this data history from publicly available records. To have your information removed, we recommend requesting removal directly through your county’s website.
Purchase Details
Purchase Details
Purchase Details
Purchase Details
Purchase Details
Purchase Details
Purchase Details
Purchase Details
Home Values in the Area
Average Home Value in this Area
Purchase History
We collect this data history from publicly available records. To have your information removed, we recommend requesting removal directly through your county’s website.
| Date | Buyer | Sale Price | Title Company |
|---|---|---|---|
| $55,000 | Regional Title Services Llc | ||
| -- | Regional Title Services Llc | ||
| -- | Lockyear Title Llc | ||
| -- | None Available | ||
| -- | None Available | ||
| -- | None Available | ||
| -- | None Available | ||
| -- | None Available |
Mortgage History
We collect this data history from publicly available records. To have your information removed, we recommend requesting removal directly through your county’s website.
| Date | Status | Borrower | Loan Amount |
|---|---|---|---|
| Closed | $0 |
Tax History
We collect this data history from publicly available records. To have your information removed, we recommend requesting removal directly through your county’s website.
| Year | Tax Paid | Tax Assessment Tax Assessment Total Assessment is a certain percentage of the fair market value that is determined by local assessors to be the total taxable value of land and additions on the property. | Land | Improvement |
|---|---|---|---|---|
| 2025 | $498 | $94,800 | $14,800 | $80,000 |
| 2024 | $408 | $77,300 | $14,800 | $62,500 |
| 2023 | $380 | $77,300 | $14,800 | $62,500 |
| 2022 | $687 | $54,300 | $6,300 | $48,000 |
| 2021 | $552 | $42,300 | $6,300 | $36,000 |
| 2020 | $541 | $41,200 | $13,200 | $28,000 |
| 2019 | $586 | $44,800 | $14,400 | $30,400 |
| 2018 | $974 | $48,700 | $12,400 | $36,300 |
| 2017 | $950 | $47,500 | $12,400 | $35,100 |
| 2016 | $942 | $47,100 | $12,400 | $34,700 |
| 2014 | $871 | $40,100 | $6,800 | $33,300 |
| 2013 | $742 | $36,300 | $6,800 | $29,500 |
Map
- 214 E Washington St
- 301 E Washington St
- 416 S State St
- 304 E Lincoln Ave
- 132 N Kentucky Ave
- 156 W Jefferson Ave
- 217 Inderrieden Rd
- 531 E Monroe Ave
- 318 W Jefferson Ave
- 121 S Tennessee St
- 509 E Jefferson Ave
- 899 Inderrieden Rd
- 6122 Gardner Rd
- 101 Wabash Dr
- 1229 Saddlebrooke Cir
- 1214 Saddlebrooke Cir
- 1054 Saddlebrooke Cir
- 7917 Drake Dr
- 922 Russell Rd
- 1087 Lakefield Dr
- 111 Walnut St
- 107 W Walnut St
- 215 S State St
- 119 W Walnut St
- 101 W Walnut St
- 125 W Walnut St
- 201 S State St
- 124 W Walnut St
- 122 W Williams St
- 127 W Walnut St
- 128 W Walnut St
- 124 W Williams St
- 202 S State St
- 214 S State St
- 126 W Williams St
- 131 W Walnut St
- 116 W Washington St
- 113 W Williams St
- 321 S State St
- 128 W Williams St
Ask me questions while you tour the home.