Estimated Value: $52,000 - $130,078
Studio
3
Baths
2,338
Sq Ft
$42/Sq Ft
Est. Value
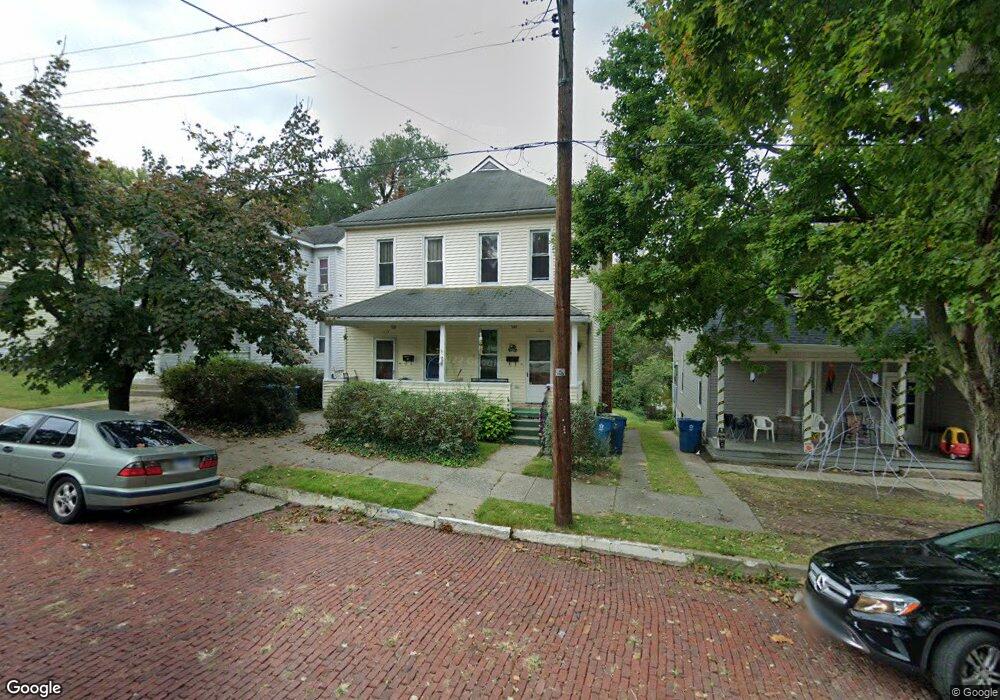
About This Home
This home is located at 1111 E 5th St, Alton, IL 62002 and is currently estimated at $97,270, approximately $41 per square foot. 1111 E 5th St is a home located in Madison County with nearby schools including West Elementary School, Alton Middle School, and Alton High School.
Ownership History
Date
Name
Owned For
Owner Type
Purchase Details
Closed on
Mar 26, 2019
Sold by
Cacciottoli Joseph and Cacciottoli Ann
Bought by
Bnc Management Co Llc
Current Estimated Value
Purchase Details
Closed on
Jan 9, 2009
Sold by
Williams Sue A
Bought by
Cacciottoli Joseph and Cacciottoli Ann
Purchase Details
Closed on
May 25, 2005
Sold by
Boker Dardanella Marie
Bought by
Williams Sue A
Home Financials for this Owner
Home Financials are based on the most recent Mortgage that was taken out on this home.
Original Mortgage
$45,500
Interest Rate
5.66%
Mortgage Type
Purchase Money Mortgage
Create a Home Valuation Report for This Property
The Home Valuation Report is an in-depth analysis detailing your home's value as well as a comparison with similar homes in the area
Home Values in the Area
Average Home Value in this Area
Purchase History
| Date | Buyer | Sale Price | Title Company |
|---|---|---|---|
| Bnc Management Co Llc | $30,000 | None Available | |
| Cacciottoli Joseph | $51,000 | First American Title Ins Co | |
| Williams Sue A | $65,000 | Freedom Land Title |
Source: Public Records
Mortgage History
| Date | Status | Borrower | Loan Amount |
|---|---|---|---|
| Previous Owner | Williams Sue A | $45,500 |
Source: Public Records
Tax History
| Year | Tax Paid | Tax Assessment Tax Assessment Total Assessment is a certain percentage of the fair market value that is determined by local assessors to be the total taxable value of land and additions on the property. | Land | Improvement |
|---|---|---|---|---|
| 2024 | $2,475 | $30,450 | $2,180 | $28,270 |
| 2023 | $2,475 | $27,500 | $1,970 | $25,530 |
| 2022 | $2,326 | $24,860 | $1,780 | $23,080 |
| 2021 | $2,140 | $23,360 | $1,670 | $21,690 |
| 2020 | $2,091 | $22,530 | $1,610 | $20,920 |
| 2019 | $2,161 | $22,010 | $1,570 | $20,440 |
| 2018 | $2,104 | $21,440 | $1,530 | $19,910 |
| 2017 | $2,074 | $21,440 | $1,530 | $19,910 |
| 2016 | $2,033 | $21,440 | $1,530 | $19,910 |
| 2015 | $1,932 | $21,440 | $1,530 | $19,910 |
| 2014 | $1,932 | $21,440 | $1,530 | $19,910 |
| 2013 | $1,932 | $22,020 | $1,570 | $20,450 |
Source: Public Records
Map
Nearby Homes
Your Personal Tour Guide
Ask me questions while you tour the home.