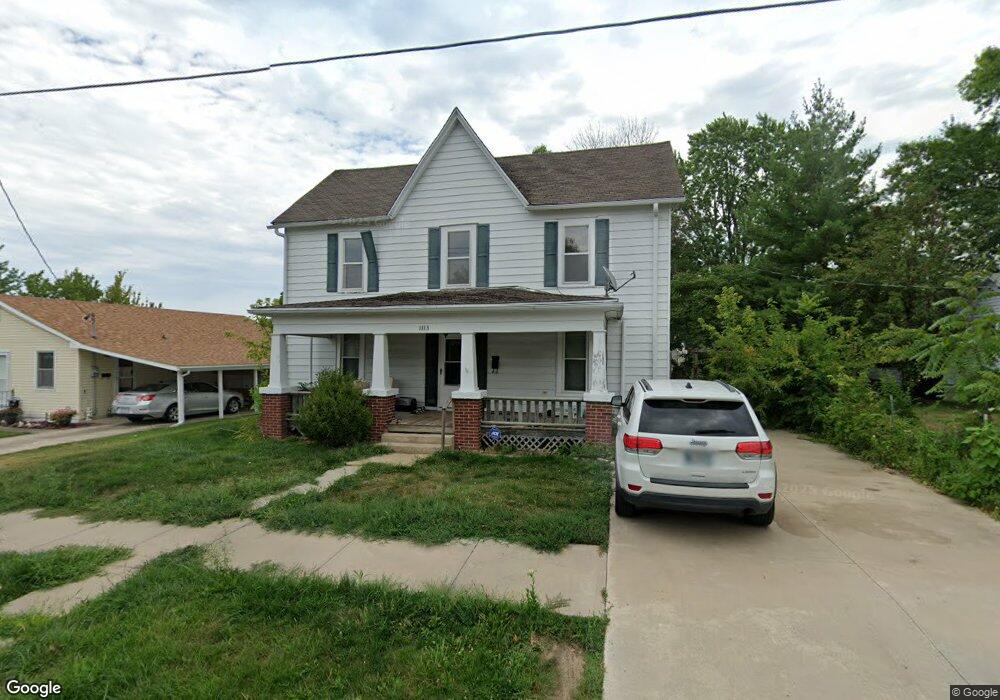
1113 Monroe St Chillicothe, MO 64601
Estimated Value: $129,000 - $149,395
3
Beds
2
Baths
1,584
Sq Ft
$87/Sq Ft
Est. Value
About This Home
This home is located at 1113 Monroe St, Chillicothe, MO 64601 and is currently estimated at $137,849, approximately $87 per square foot. 1113 Monroe St is a home located in Livingston County with nearby schools including Chillicothe Elementary School, Field Elementary School, and Dewey Elementary School.
Ownership History
Date
Name
Owned For
Owner Type
Purchase Details
Closed on
Jun 9, 2020
Sold by
The Secretary Of Veterans Affairs
Bought by
Cashatt Jayla
Current Estimated Value
Home Financials for this Owner
Home Financials are based on the most recent Mortgage that was taken out on this home.
Original Mortgage
$47,045
Outstanding Balance
$41,623
Interest Rate
3.1%
Mortgage Type
New Conventional
Estimated Equity
$96,226
Purchase Details
Closed on
Feb 21, 2020
Sold by
Lakeview Loan Servicing Llc
Bought by
Secretar5y Of Veterans Affairs
Purchase Details
Closed on
Jan 23, 2020
Sold by
Buttz Rodney
Bought by
Lakeview Loan Servicing Llc
Purchase Details
Closed on
Aug 10, 2018
Sold by
Johnson Scott R and Johnson Kasey J
Bought by
Buttz Rodney E
Home Financials for this Owner
Home Financials are based on the most recent Mortgage that was taken out on this home.
Original Mortgage
$64,046
Interest Rate
5.75%
Mortgage Type
VA
Create a Home Valuation Report for This Property
The Home Valuation Report is an in-depth analysis detailing your home's value as well as a comparison with similar homes in the area
Home Values in the Area
Average Home Value in this Area
Purchase History
| Date | Buyer | Sale Price | Title Company |
|---|---|---|---|
| Cashatt Jayla | -- | None Available | |
| Secretar5y Of Veterans Affairs | -- | Servicelink | |
| Lakeview Loan Servicing Llc | $65,139 | None Available | |
| Buttz Rodney E | -- | Sullivan County Title |
Source: Public Records
Mortgage History
| Date | Status | Borrower | Loan Amount |
|---|---|---|---|
| Open | Cashatt Jayla | $47,045 | |
| Previous Owner | Buttz Rodney E | $64,046 |
Source: Public Records
Tax History
| Year | Tax Paid | Tax Assessment Tax Assessment Total Assessment is a certain percentage of the fair market value that is determined by local assessors to be the total taxable value of land and additions on the property. | Land | Improvement |
|---|---|---|---|---|
| 2025 | $757 | $10,660 | $1,270 | $9,390 |
| 2024 | $757 | $10,290 | $1,270 | $9,020 |
| 2023 | $747 | $10,290 | $1,270 | $9,020 |
| 2022 | $674 | $9,340 | $1,270 | $8,070 |
| 2020 | $606 | $8,330 | $1,270 | $7,060 |
| 2019 | $604 | $8,330 | $1,270 | $7,060 |
| 2018 | $463 | $6,410 | $1,270 | $5,140 |
| 2017 | $463 | $6,410 | $1,270 | $5,140 |
| 2016 | $464 | $6,410 | $1,270 | $5,140 |
| 2015 | -- | $6,410 | $1,270 | $5,140 |
| 2011 | -- | $33,750 | $6,700 | $27,050 |
Source: Public Records
Map
Nearby Homes
- 1132 Cooper St
- 1307 Springhill Rd
- 1208 Locust St
- 1418 Polk St
- Hwy 65 Highway 65
- 409 Polk St
- 1303 Jackson St
- 1315 Jackson St
- 663 Elmdale Rd
- 1011 Vine St
- 921 Clay St
- 709 Highland Ave
- 1510 Jackson St
- 453 Elm St
- 1309 Directory St
- 340 Mansur St
- 1105 Hillside Dr
- 339 Wilson St
- 1402 Maple St
- 1707 Calhoun St
Your Personal Tour Guide
Ask me questions while you tour the home.