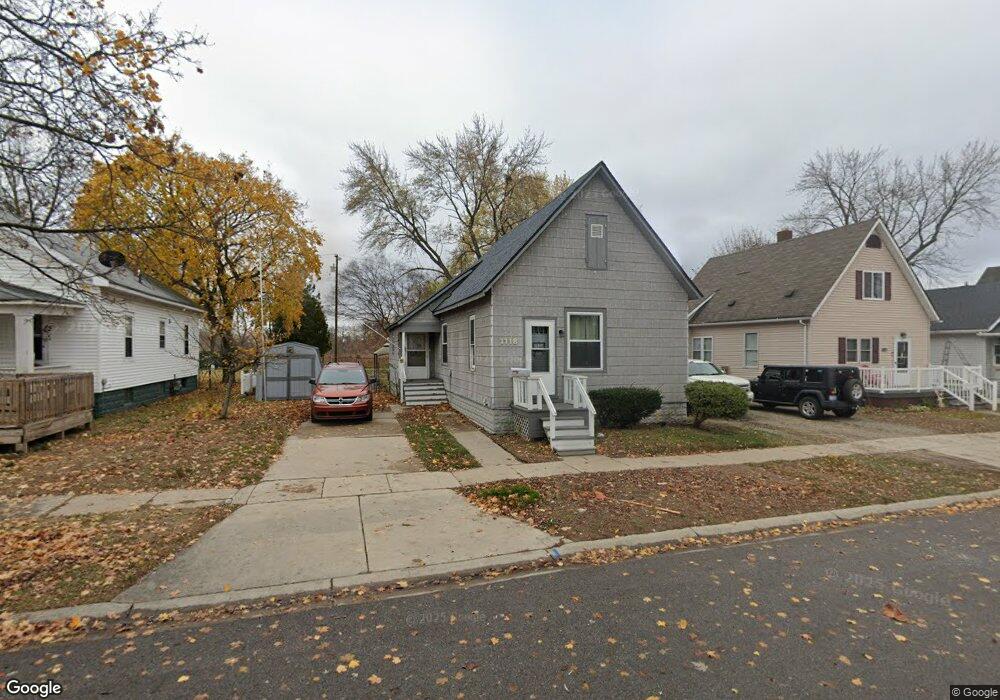
1118 Cedar St Port Huron, MI 48060
Estimated Value: $111,686 - $124,000
3
Beds
1
Bath
936
Sq Ft
$127/Sq Ft
Est. Value
About This Home
This home is located at 1118 Cedar St, Port Huron, MI 48060 and is currently estimated at $118,422, approximately $126 per square foot. 1118 Cedar St is a home located in St. Clair County with nearby schools including Woodrow Wilson Elementary School, Central Middle School, and Port Huron High School.
Ownership History
Date
Name
Owned For
Owner Type
Purchase Details
Closed on
Feb 28, 2025
Sold by
Ireland Douglas P and Ireland Chad J
Bought by
Mcknight Desiree M
Current Estimated Value
Purchase Details
Closed on
Dec 22, 2010
Sold by
Ireland Eleanor M and Ireland Douglas P
Bought by
Ireland Douglas P
Purchase Details
Closed on
Oct 6, 2010
Sold by
Ireland Eleanor M
Bought by
Ireland Eleanor M and Ireland Douglas P
Purchase Details
Closed on
Feb 2, 2006
Sold by
Ireland Eleanor M
Bought by
Ireland Eleanor M and Eleanor M Ireland Trust
Create a Home Valuation Report for This Property
The Home Valuation Report is an in-depth analysis detailing your home's value as well as a comparison with similar homes in the area
Home Values in the Area
Average Home Value in this Area
Purchase History
| Date | Buyer | Sale Price | Title Company |
|---|---|---|---|
| Mcknight Desiree M | -- | None Listed On Document | |
| Ireland Douglas P | -- | None Available | |
| Ireland Eleanor M | -- | None Available | |
| Ireland Eleanor M | -- | None Available |
Source: Public Records
Tax History
| Year | Tax Paid | Tax Assessment Tax Assessment Total Assessment is a certain percentage of the fair market value that is determined by local assessors to be the total taxable value of land and additions on the property. | Land | Improvement |
|---|---|---|---|---|
| 2025 | $963 | $46,800 | $0 | $0 |
| 2024 | $938 | $45,200 | $0 | $0 |
| 2023 | $886 | $39,800 | $0 | $0 |
| 2022 | $862 | $33,400 | $0 | $0 |
| 2020 | $828 | $24,800 | $24,800 | $0 |
| 2019 | $813 | $17,600 | $0 | $0 |
| 2018 | $795 | $17,600 | $0 | $0 |
| 2017 | $712 | $16,700 | $0 | $0 |
| 2016 | $897 | $16,700 | $0 | $0 |
| 2015 | $932 | $16,600 | $16,600 | $0 |
| 2014 | $932 | $17,300 | $17,300 | $0 |
| 2013 | -- | $19,300 | $0 | $0 |
Source: Public Records
Map
Nearby Homes
Your Personal Tour Guide
Ask me questions while you tour the home.