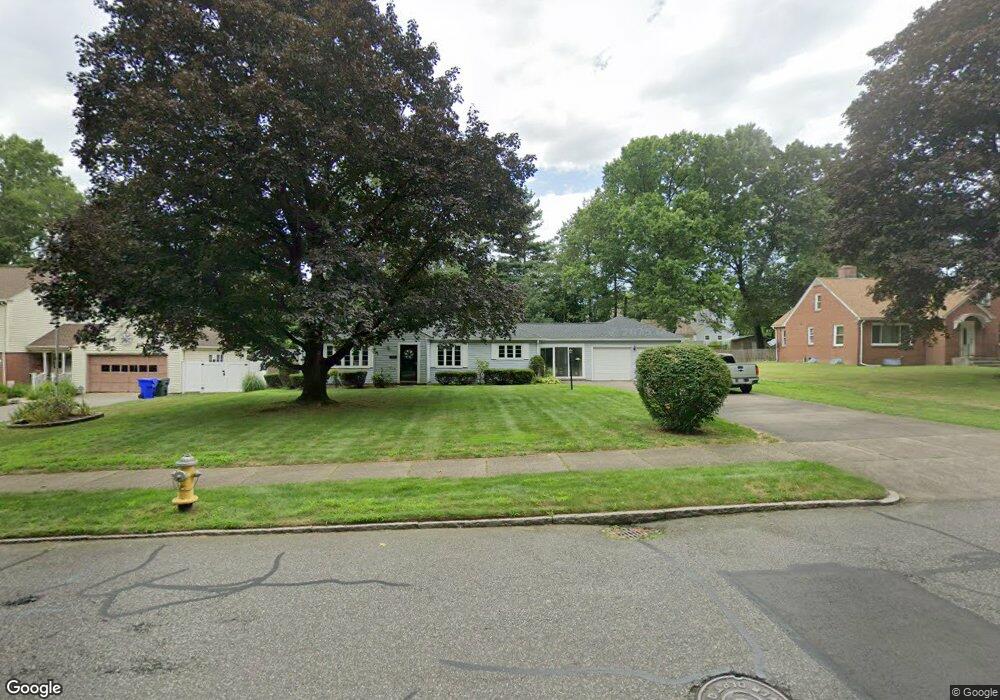
112 Cunningham St Springfield, MA 01107
Liberty Heights NeighborhoodEstimated Value: $261,000 - $406,000
3
Beds
2
Baths
1,230
Sq Ft
$249/Sq Ft
Est. Value
About This Home
This home is located at 112 Cunningham St, Springfield, MA 01107 and is currently estimated at $306,667, approximately $249 per square foot. 112 Cunningham St is a home located in Hampden County with nearby schools including High School Of Commerce, Springfield High School of Science and Technology, and Roger L. Putnam Vocational Technical Academy.
Ownership History
Date
Name
Owned For
Owner Type
Purchase Details
Closed on
Jul 22, 2002
Sold by
Lanzarotto Ronald V and Desroches Lucille
Bought by
Seipel Joseph M and Abrahamson Christine A
Current Estimated Value
Home Financials for this Owner
Home Financials are based on the most recent Mortgage that was taken out on this home.
Original Mortgage
$147,250
Interest Rate
6.73%
Mortgage Type
Purchase Money Mortgage
Create a Home Valuation Report for This Property
The Home Valuation Report is an in-depth analysis detailing your home's value as well as a comparison with similar homes in the area
Home Values in the Area
Average Home Value in this Area
Purchase History
| Date | Buyer | Sale Price | Title Company |
|---|---|---|---|
| Seipel Joseph M | $155,000 | -- | |
| Seipel Joseph M | $155,000 | -- |
Source: Public Records
Mortgage History
| Date | Status | Borrower | Loan Amount |
|---|---|---|---|
| Open | Seipel Joseph M | $130,000 | |
| Closed | Seipel Joseph M | $147,250 |
Source: Public Records
Tax History
| Year | Tax Paid | Tax Assessment Tax Assessment Total Assessment is a certain percentage of the fair market value that is determined by local assessors to be the total taxable value of land and additions on the property. | Land | Improvement |
|---|---|---|---|---|
| 2025 | $4,580 | $292,100 | $55,200 | $236,900 |
| 2024 | $4,648 | $289,400 | $55,200 | $234,200 |
| 2023 | $4,861 | $285,100 | $52,600 | $232,500 |
| 2022 | $4,118 | $218,800 | $52,600 | $166,200 |
| 2021 | $3,965 | $209,800 | $47,800 | $162,000 |
| 2020 | $3,972 | $203,400 | $47,800 | $155,600 |
| 2019 | $3,786 | $192,400 | $47,800 | $144,600 |
| 2018 | $3,631 | $184,500 | $47,800 | $136,700 |
| 2017 | $3,456 | $175,800 | $47,500 | $128,300 |
| 2016 | $3,256 | $165,600 | $47,500 | $118,100 |
| 2015 | $3,305 | $168,000 | $47,500 | $120,500 |
Source: Public Records
Map
Nearby Homes
- 211-213 Chapin Terrace
- 24 Melha Ave
- 85 Narragansett St
- 118 Wait St
- 121 Wait St
- 113 Lexington St
- 57 Narragansett St
- 156 Farnsworth St
- 571-573 Carew St
- 35-37 Narragansett St
- 127 Governor St
- 21 Merwin St
- 708-710 Carew St
- 78 Prospect St
- 774-776 Liberty St
- 1078 Liberty St
- 177 Marion St
- 491-493 Newbury St
- 248 Hampden St
- 148-150 Stafford St
- 122 Cunningham St
- 102 Cunningham St
- 101 Caseland St
- 95 Caseland St
- 109 Caseland St
- 94 Cunningham St
- 134 Cunningham St Unit 136
- 136 Cunningham St
- 136 Cunningham St Unit 136
- 87 Caseland St
- 88 Cunningham St
- 125 Caseland St Unit 1
- 125 Caseland St
- 125 Caseland St Unit 2
- 142 Cunningham St
- 75 Caseland St
- 131 Caseland St Unit 133
- 78 Cunningham St
- 69 Caseland St
- 104 Caseland St
Your Personal Tour Guide
Ask me questions while you tour the home.