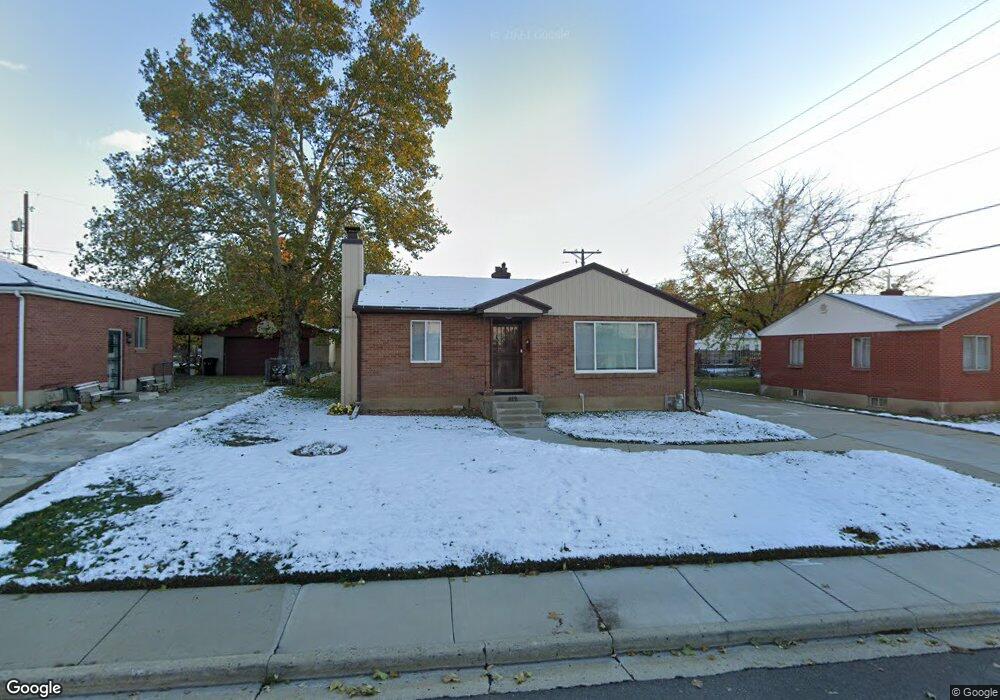
112 E 1050 N Bountiful, UT 84010
Estimated Value: $433,000 - $488,000
4
Beds
2
Baths
889
Sq Ft
$515/Sq Ft
Est. Value
About This Home
This home is located at 112 E 1050 N, Bountiful, UT 84010 and is currently estimated at $457,436, approximately $514 per square foot. 112 E 1050 N is a home located in Davis County with nearby schools including Tolman School, Bountiful Junior High School, and Viewmont High School.
Ownership History
Date
Name
Owned For
Owner Type
Purchase Details
Closed on
Jul 14, 2025
Sold by
Poll Spencer
Bought by
Poll Spencer and Poll Hannah Mitzi
Current Estimated Value
Home Financials for this Owner
Home Financials are based on the most recent Mortgage that was taken out on this home.
Original Mortgage
$225,000
Outstanding Balance
$224,622
Interest Rate
6.89%
Mortgage Type
New Conventional
Estimated Equity
$232,814
Purchase Details
Closed on
Mar 17, 2021
Sold by
Luker James K
Bought by
Luker James K and James K Luker Trust
Create a Home Valuation Report for This Property
The Home Valuation Report is an in-depth analysis detailing your home's value as well as a comparison with similar homes in the area
Purchase History
| Date | Buyer | Sale Price | Title Company |
|---|---|---|---|
| Poll Spencer | -- | Backman Title Services | |
| Poll Spencer | -- | Backman Title Services | |
| Poll Spencer | -- | None Listed On Document | |
| Poll Spencer | -- | None Listed On Document | |
| Luker James K | -- | None Available |
Source: Public Records
Mortgage History
| Date | Status | Borrower | Loan Amount |
|---|---|---|---|
| Open | Poll Spencer | $225,000 | |
| Closed | Poll Spencer | $225,000 |
Source: Public Records
Tax History
| Year | Tax Paid | Tax Assessment Tax Assessment Total Assessment is a certain percentage of the fair market value that is determined by local assessors to be the total taxable value of land and additions on the property. | Land | Improvement |
|---|---|---|---|---|
| 2025 | $2,506 | $226,600 | $121,628 | $104,972 |
| 2024 | $2,336 | $220,000 | $105,679 | $114,321 |
| 2023 | $2,259 | $386,000 | $197,240 | $188,760 |
| 2022 | $2,201 | $205,700 | $108,468 | $97,232 |
| 2021 | $2,036 | $291,000 | $141,834 | $149,166 |
| 2020 | $1,802 | $258,000 | $122,097 | $135,903 |
| 2019 | $1,829 | $256,000 | $135,515 | $120,485 |
| 2018 | $1,681 | $231,000 | $132,991 | $98,009 |
| 2016 | $1,410 | $104,665 | $52,919 | $51,746 |
| 2015 | $1,389 | $97,350 | $52,919 | $44,431 |
| 2014 | $1,434 | $103,864 | $52,919 | $50,945 |
| 2013 | -- | $95,562 | $40,825 | $54,737 |
Source: Public Records
Map
Nearby Homes
- 978 N 170 E
- 214 E 1250 N
- 1420 N Main St
- 106 W 700 N
- 17 E 400 N Unit 19B
- 1130 N 200 W
- 1260 N 200 W
- 513 N 400 E Unit 14B
- 453 N 400 E Unit 7-D
- 967 S Courtyard Ln
- 235 W 1400 N
- 563 N 200 W
- 499 N 200 W Unit 30
- 499 N 200 W Unit 19
- 252 N Main St
- 207 E 820 S
- 49 E 200 N Unit 4
- 41 E 200 N Unit 6
- 256 N Main St
- 254 N Main St
Your Personal Tour Guide
Ask me questions while you tour the home.