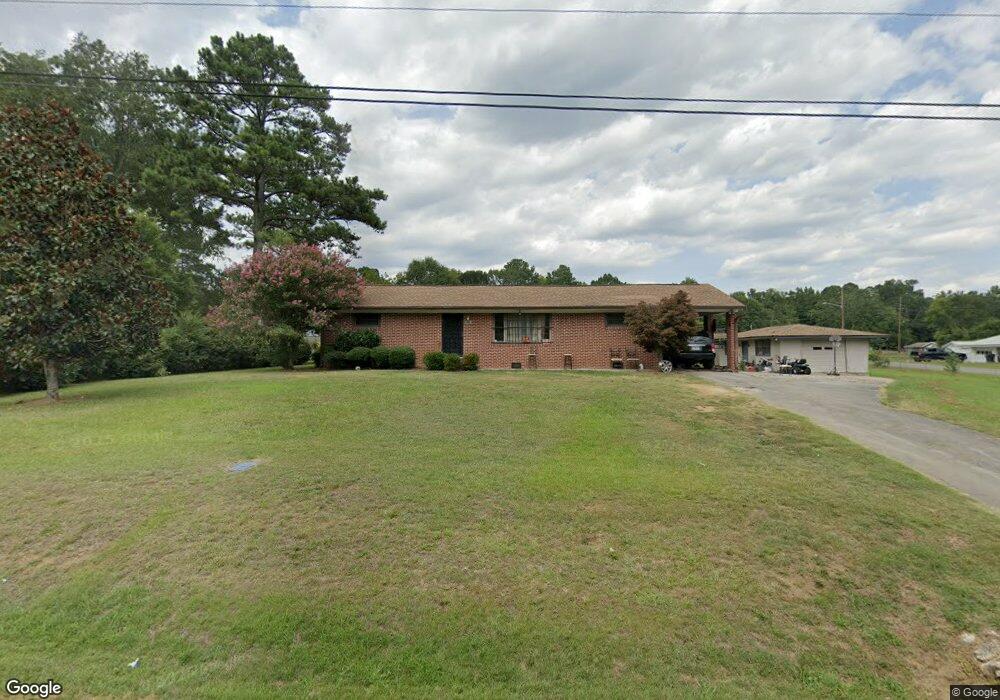
112 Second Ave Summerville, GA 30747
Estimated Value: $146,000 - $178,000
3
Beds
2
Baths
1,000
Sq Ft
$165/Sq Ft
Est. Value
About This Home
This home is located at 112 Second Ave, Summerville, GA 30747 and is currently estimated at $164,636, approximately $164 per square foot. 112 Second Ave is a home located in Chattooga County with nearby schools including Chattooga High School.
Ownership History
Date
Name
Owned For
Owner Type
Purchase Details
Closed on
Aug 14, 2008
Sold by
Federal National Mortgage Association
Bought by
Agnew John A
Current Estimated Value
Purchase Details
Closed on
Mar 4, 2008
Sold by
Not Provided
Bought by
Agnew John A
Purchase Details
Closed on
Apr 25, 2007
Sold by
Not Provided
Bought by
Agnew John A
Home Financials for this Owner
Home Financials are based on the most recent Mortgage that was taken out on this home.
Original Mortgage
$52,000
Interest Rate
6.1%
Mortgage Type
New Conventional
Purchase Details
Closed on
Aug 8, 2006
Sold by
Not Provided
Bought by
Agnew John A
Create a Home Valuation Report for This Property
The Home Valuation Report is an in-depth analysis detailing your home's value as well as a comparison with similar homes in the area
Home Values in the Area
Average Home Value in this Area
Purchase History
| Date | Buyer | Sale Price | Title Company |
|---|---|---|---|
| Agnew John A | $39,900 | -- | |
| Agnew John A | $48,027 | -- | |
| Agnew John A | $48,027 | -- | |
| Agnew John A | $52,000 | -- | |
| Agnew John A | -- | -- | |
| Agnew John A | -- | -- |
Source: Public Records
Mortgage History
| Date | Status | Borrower | Loan Amount |
|---|---|---|---|
| Previous Owner | Agnew John A | $52,000 |
Source: Public Records
Tax History
| Year | Tax Paid | Tax Assessment Tax Assessment Total Assessment is a certain percentage of the fair market value that is determined by local assessors to be the total taxable value of land and additions on the property. | Land | Improvement |
|---|---|---|---|---|
| 2025 | $946 | $43,880 | $1,800 | $42,080 |
| 2024 | $1,002 | $44,080 | $1,800 | $42,280 |
| 2023 | $1,237 | $44,080 | $1,800 | $42,280 |
| 2022 | $831 | $29,617 | $1,795 | $27,822 |
| 2021 | $691 | $22,457 | $1,795 | $20,662 |
| 2020 | $719 | $22,457 | $1,795 | $20,662 |
| 2019 | $732 | $22,457 | $1,795 | $20,662 |
| 2018 | $695 | $22,233 | $1,795 | $20,438 |
| 2017 | $761 | $23,365 | $1,800 | $21,565 |
| 2016 | $676 | $23,365 | $1,800 | $21,565 |
| 2015 | -- | $21,370 | $1,800 | $19,570 |
| 2014 | -- | $21,371 | $1,800 | $19,571 |
| 2013 | -- | $19,600 | $1,484 | $18,115 |
Source: Public Records
Map
Nearby Homes
- 16 Laredo Dr
- 153 Maple Dr
- 103 Highland Ave
- 562 Highland Ave
- 14 Favor St
- 10117 Commerce St
- 16 Bittings Ave
- 108 Scoggins St
- 155 Scoggins St
- 60 Union St
- 10895 Commerce St
- 0 Scoggins St Unit 10721048
- 286 Allen St
- 15 Taylor St
- 0 N Lewis St Unit 10667185
- 46 Megginson Dr
- 622 Scoggins St
- 102 Oak St
- 100 Henry Branch Rd
- 412 W First Ave
Your Personal Tour Guide
Ask me questions while you tour the home.